Chinese
- REPORT SUMMARY
- TABLE OF CONTENTS
-
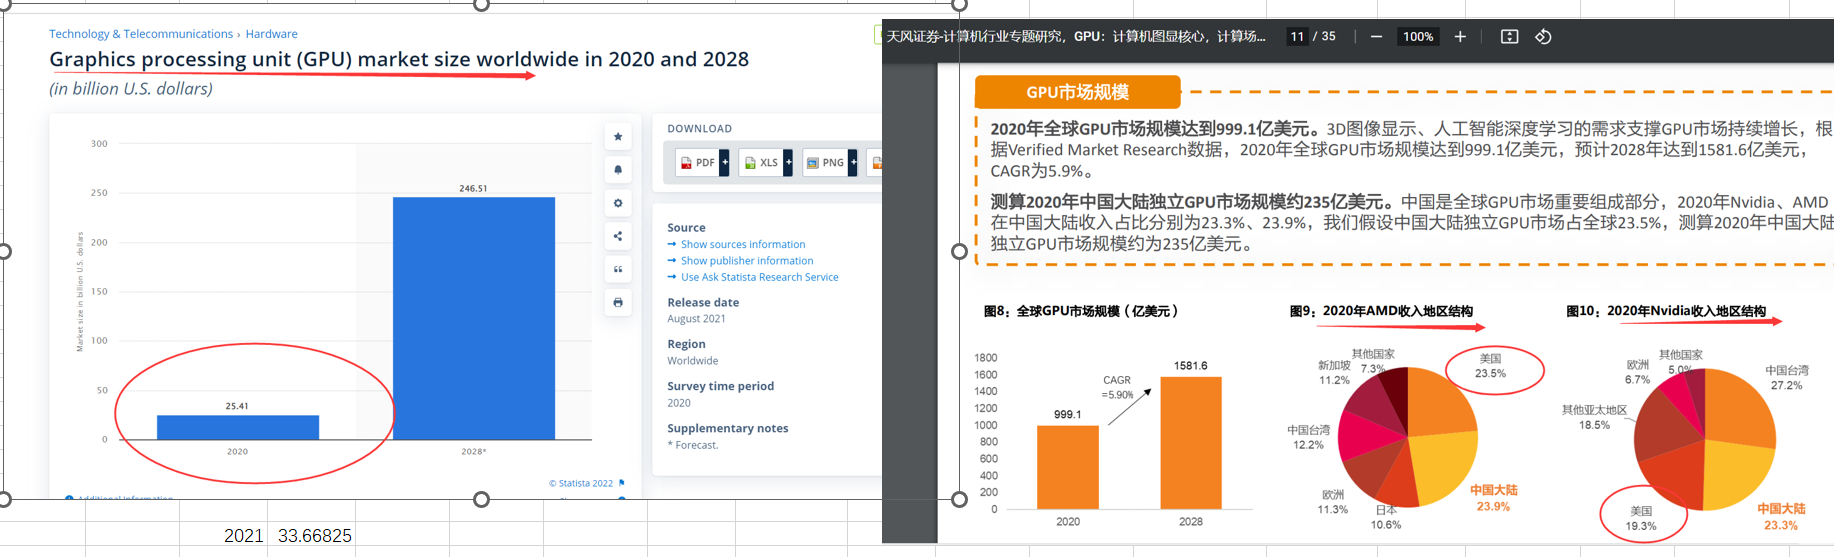
https://www.statista.com/statistics/1166028/gpu-market-size-worldwide/
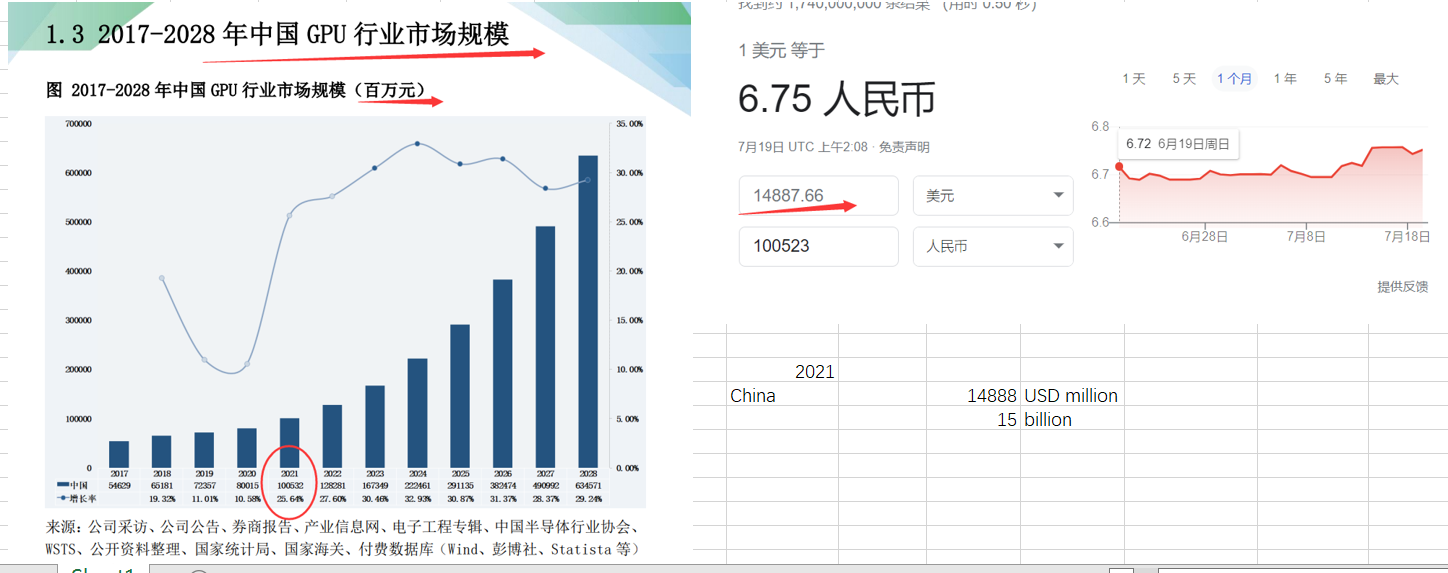
https://pdf.dfcfw.com/pdf/H3_AP202111101528199831_1.pdf?1636553716000.pdf
This report elaborates on the current development of the Graphics Processing Unit (GPU) industry thoroughly based on the international market dynamics and China's market situation.
For a start, the report provides an in-depth analysis of the current market situation through three different aspects - by region, by type and by application, which includes market distribution of different types and applications, import and export analysis of major regions, development trends of different types of products in each region, market opportunities and market restrains of different applications.
Secondly, this report lists the major players in the industry, displaying their market positions and strengths and weaknesses of their products, picturing the current competitive situation of the whole market.
Last but not least, the report analyzes and predicts the investment prospects and risks in the industry on the basis of industry data, combined with experts' opinions and suggestions.
By Player:
Samsung Electronics Co Ltd
ARM Holdings Plc
Intel Corporation
Jinjia MICRO
Apple
Taiwan Advanced Micro Devices Inc
Qualcomm
Imagination Technologies
Alphabet Inc
Gigabyte Technology Co Ltd
By Type:
Integrated
Dedicated
By Application:
Media and Entertainment
IT & Telecom
Defense and Intelligence
Electronic
Automobile
By Research Region:
-
North China
-
Central China
-
South China
-
East China
-
Northeast China
-
Southwest China
-
Northwest China
TABLE OF CONTENT
Chapter 1 China Graphics Processing Unit (GPU) Market Overview 2018-2029
-
1.1 China Graphics Processing Unit (GPU) Industry Development Overview
-
1.2 China Graphics Processing Unit (GPU) Industry Development History
-
1.3 China Graphics Processing Unit (GPU) Industry Market Size (2018-2029)
-
1.4 China Graphics Processing Unit (GPU) Market Analysis by Type from Production Side
-
1.4.1 China Graphics Processing Unit (GPU) Production Volume, Production Value and Growth Rate of Integrated (2018-2029)
-
1.4.2 China Graphics Processing Unit (GPU) Production Volume, Production Value and Growth Rate of Dedicated (2018-2029)
-
1.5 China Graphics Processing Unit (GPU) Market Analysis by Application from Consumption End
-
1.5.1 China Graphics Processing Unit (GPU) Sales Volume, Sales Value and Growth Rate of Media and Entertainment (2018-2029)
-
1.5.2 China Graphics Processing Unit (GPU) Sales Volume, Sales Value and Growth Rate of IT & Telecom (2018-2029)
-
1.5.3 China Graphics Processing Unit (GPU) Sales Volume, Sales Value and Growth Rate of Defense and Intelligence (2018-2029)
-
1.5.4 China Graphics Processing Unit (GPU) Sales Volume, Sales Value and Growth Rate of Electronic (2018-2029)
-
1.5.5 China Graphics Processing Unit (GPU) Sales Volume, Sales Value and Growth Rate of Automobile (2018-2029)
-
1.6 China Graphics Processing Unit (GPU) Market Analysis by Region
-
1.6.1 North China Graphics Processing Unit (GPU) Market Size and Growth Rate from 2018-2029
-
1.6.2 Central China Graphics Processing Unit (GPU) Market Size and Growth Rate from 2018-2029
-
1.6.3 South China Graphics Processing Unit (GPU) Market Size and Growth Rate from 2018-2029
-
1.6.4 East China Graphics Processing Unit (GPU) Market Size and Growth Rate from 2018-2029
-
1.6.5 Northeast China Graphics Processing Unit (GPU) Market Size and Growth Rate from 2018-2029
-
1.6.6 Southwest China Graphics Processing Unit (GPU) Market Size and Growth Rate from 2018-2029
-
1.6.7 Northwest China Graphics Processing Unit (GPU) Market Size and Growth Rate from 2018-2029
Chapter 2 China Graphics Processing Unit (GPU) Industry Development Environment
-
2.1 Industry Development Environment Analysis
-
2.1.1 Industry Technological Progress Analysis
-
2.1.2 Industrial Organizational Innovation Analysis
-
2.1.3 Changes in Social Habits
-
2.1.4 Alterations in Government Policies
-
2.1.5 Impact of Economic Globalization
-
2.2 Domestic and Foreign Industry Competition Analysis
-
2.2.1 Comparative Analysis on Graphics Processing Unit (GPU) Market Status and Competition at home and abroad in 2023
-
2.2.2 China Graphics Processing Unit (GPU) Market Status and Competition Analysis in 2023
-
2.2.3 China Graphics Processing Unit (GPU) Market Concentration Analysis in 2023
-
2.3 Problems and Countermeasures in the development of China Graphics Processing Unit (GPU) Industry
-
2.3.1 Industry Development Constraints
-
2.3.2 Industry Development Considerations
-
2.3.3 Suggestions on Industry Development Measures
-
2.3.4 Development Strategies for SMEs
-
2.4 Influence of COVID-19 Outbreak on Graphics Processing Unit (GPU) Industry Development
Chapter 3 Graphics Processing Unit (GPU)Industry Chain Analysis
-
3.1 Graphics Processing Unit (GPU) Industry Chain
-
3.2 Graphics Processing Unit (GPU) Upstream Industry Analysis
-
3.2.1 Upstream Industry Development Status
-
3.2.2 Upstream Industry Development Forecast
-
3.2.3 Impact of Upstream Industry on the Graphics Processing Unit (GPU) Market
-
3.3 Graphics Processing Unit (GPU) Downstream Industry Analysis
-
3.3.1 Downstream Industry Development Status
-
3.3.2 Downstream Industry Development Forecast
-
3.3.3 Impact of Downstream Industry on the Graphics Processing Unit (GPU) Market
Chapter 4 China Graphics Processing Unit (GPU) Market, by Type
-
4.1 China Graphics Processing Unit (GPU) Market Trend, by Type
-
4.2 Product Types of Major Suppliers
-
4.3 Competitive Landscape of Major Types
-
4.4 China Graphics Processing Unit (GPU) Total Production Volume and Growth Rate from Production Side
-
4.5 China Graphics Processing Unit (GPU) Production Volume and Growth Rate, by Type
-
4.5.1 China Graphics Processing Unit (GPU) Production Volume and Growth Rate of Integrated
-
4.5.2 China Graphics Processing Unit (GPU) Production Volume and Growth Rate of Dedicated
Chapter 5 China Graphics Processing Unit (GPU) Market, by Application
-
5.1 Downstream Market Overview
-
5.2 Competitive Landscape of Major Applications
-
5.3 Market Potential Analysis, by Application
-
5.4 China Graphics Processing Unit (GPU) Total Market Size and Growth Rate from Consumption End
-
5.5 China Graphics Processing Unit (GPU) Market Size and Growth Rate, by Application
-
5.5.1 China Graphics Processing Unit (GPU) Market Size and Growth Rate of Media and Entertainment
-
5.5.2 China Graphics Processing Unit (GPU) Market Size and Growth Rate of IT & Telecom
-
5.5.3 China Graphics Processing Unit (GPU) Market Size and Growth Rate of Defense and Intelligence
-
5.5.4 China Graphics Processing Unit (GPU) Market Size and Growth Rate of Electronic
-
5.5.5 China Graphics Processing Unit (GPU) Market Size and Growth Rate of Automobile
Chapter 6 China Graphics Processing Unit (GPU) Market, by Region
-
6.1 China Graphics Processing Unit (GPU) Production Volume and Production Value, by Region
-
6.2 China Graphics Processing Unit (GPU) Sales Volume and Sales Value, by Region
Chapter 7 North China Graphics Processing Unit (GPU) Market Analysis
-
7.1 North China Graphics Processing Unit (GPU) Market, by Type
-
7.2 North China Graphics Processing Unit (GPU) Market, by Application
Chapter 8 Central China Graphics Processing Unit (GPU) Market Analysis
-
8.1 Central China Graphics Processing Unit (GPU) Market, by Type
-
8.2 Central China Graphics Processing Unit (GPU) Market, by Application
Chapter 9 South China Graphics Processing Unit (GPU) Market Analysis
-
9.1 South China Graphics Processing Unit (GPU) Market, by Type
-
9.2 South China Graphics Processing Unit (GPU) Market, by Application
Chapter 10 East China Graphics Processing Unit (GPU) Market Analysis
-
10.1 East China Graphics Processing Unit (GPU) Market, by Type
-
10.2 East China Graphics Processing Unit (GPU) Market, by Application
Chapter 11 Northeast China Graphics Processing Unit (GPU) Market Analysis
-
11.1 Northeast China Graphics Processing Unit (GPU) Market, by Type
-
11.2 Northeast China Graphics Processing Unit (GPU) Market, by Application
Chapter 12 Southwest China Graphics Processing Unit (GPU) Market Analysis
-
12.1 Southwest China Graphics Processing Unit (GPU) Market, by Type
-
12.2 Southwest China Graphics Processing Unit (GPU) Market, by Application
Chapter 13 Northwest China Graphics Processing Unit (GPU) Market Analysis
-
13.1 Northwest China Graphics Processing Unit (GPU) Market, by Type
-
13.2 Northwest China Graphics Processing Unit (GPU) Market, by Application
Chapter 14 Company Profiles
-
14.1 Samsung Electronics Co Ltd
-
14.1.1 Samsung Electronics Co Ltd Company Profile
-
14.1.2 Samsung Electronics Co Ltd Graphics Processing Unit (GPU) Market Performance
-
14.1.3 Product&Service Introduction
-
14.2 ARM Holdings Plc
-
14.2.1 ARM Holdings Plc Company Profile
-
14.2.2 ARM Holdings Plc Graphics Processing Unit (GPU) Market Performance
-
14.2.3 Product&Service Introduction
-
14.3 Intel Corporation
-
14.3.1 Intel Corporation Company Profile
-
14.3.2 Intel Corporation Graphics Processing Unit (GPU) Market Performance
-
14.3.3 Product&Service Introduction
-
14.4 Jinjia MICRO
-
14.4.1 Jinjia MICRO Company Profile
-
14.4.2 Jinjia MICRO Graphics Processing Unit (GPU) Market Performance
-
14.4.3 Product&Service Introduction
-
14.5 Apple
-
14.5.1 Apple Company Profile
-
14.5.2 Apple Graphics Processing Unit (GPU) Market Performance
-
14.5.3 Product&Service Introduction
-
14.6 Taiwan Advanced Micro Devices Inc
-
14.6.1 Taiwan Advanced Micro Devices Inc Company Profile
-
14.6.2 Taiwan Advanced Micro Devices Inc Graphics Processing Unit (GPU) Market Performance
-
14.6.3 Product&Service Introduction
-
14.7 Qualcomm
-
14.7.1 Qualcomm Company Profile
-
14.7.2 Qualcomm Graphics Processing Unit (GPU) Market Performance
-
14.7.3 Product&Service Introduction
-
14.8 Imagination Technologies
-
14.8.1 Imagination Technologies Company Profile
-
14.8.2 Imagination Technologies Graphics Processing Unit (GPU) Market Performance
-
14.8.3 Product&Service Introduction
-
14.9 Alphabet Inc
-
14.9.1 Alphabet Inc Company Profile
-
14.9.2 Alphabet Inc Graphics Processing Unit (GPU) Market Performance
-
14.9.3 Product&Service Introduction
-
14.10 Gigabyte Technology Co Ltd
-
14.10.1 Gigabyte Technology Co Ltd Company Profile
-
14.10.2 Gigabyte Technology Co Ltd Graphics Processing Unit (GPU) Market Performance
-
14.10.3 Product&Service Introduction
Chapter 15 Research Conclusions and Investment Suggestions
-
15.1 Graphics Processing Unit (GPU) Industry Research Conclusions
-
15.2 Graphics Processing Unit (GPU) Industry Investment Suggestions
-
15.2.1 Suggestions on Industry Development Strategy
-
15.2.2 Suggestions on Industry Investment Direction
-
15.2.3 Suggestions on Industry Investment Strategy
List of Tables and Figures
-
Figure China Graphics Processing Unit (GPU) Industry Market Size (2018-2029)
-
Figure China Graphics Processing Unit (GPU) Production Volume, Production Value and Growth Rate of Integrated (2018-2029)
-
Figure China Graphics Processing Unit (GPU) Production Volume, Production Value and Growth Rate of Dedicated (2018-2029)
-
Figure China Graphics Processing Unit (GPU) Sales Volume, Sales Value and Growth Rate of Media and Entertainment (2018-2029)
-
Figure China Graphics Processing Unit (GPU) Sales Volume, Sales Value and Growth Rate of IT & Telecom (2018-2029)
-
Figure China Graphics Processing Unit (GPU) Sales Volume, Sales Value and Growth Rate of Defense and Intelligence (2018-2029)
-
Figure China Graphics Processing Unit (GPU) Sales Volume, Sales Value and Growth Rate of Electronic (2018-2029)
-
Figure China Graphics Processing Unit (GPU) Sales Volume, Sales Value and Growth Rate of Automobile (2018-2029)
-
Figure North China Graphics Processing Unit (GPU) Market Size and Growth Rate from 2018-2029
-
Figure Central China Graphics Processing Unit (GPU) Market Size and Growth Rate from 2018-2029
-
Figure South China Graphics Processing Unit (GPU) Market Size and Growth Rate from 2018-2029
-
Figure East China Graphics Processing Unit (GPU) Market Size and Growth Rate from 2018-2029
-
Figure Northeast China Graphics Processing Unit (GPU) Market Size and Growth Rate from 2018-2029
-
Figure Southwest China Graphics Processing Unit (GPU) Market Size and Growth Rate from 2018-2029
-
Figure Northwest China Graphics Processing Unit (GPU) Market Size and Growth Rate from 2018-2029
-
Figure Graphics Processing Unit (GPU) Industry Chain
-
Table Product Types of Major Suppliers in 2023
-
Figure China Graphics Processing Unit (GPU) Market Share by Type in 2018
-
Figure China Graphics Processing Unit (GPU) Market Share by Type in 2023
-
Figure China Graphics Processing Unit (GPU) Total Production Volume and Growth Rate from Production Side (2018-2023)
-
Figure China Graphics Processing Unit (GPU) Production Volume and Growth Rate of Integrated (2018-2023)
-
Figure China Graphics Processing Unit (GPU) Production Volume and Growth Rate of Dedicated (2018-2023)
-
Figure China Graphics Processing Unit (GPU) Market Share by Application in 2018
-
Figure China Graphics Processing Unit (GPU) Market Share by Application in 2023
-
Figure China Graphics Processing Unit (GPU) Total Market Size and Growth Rate from Consumption End
-
Figure China Graphics Processing Unit (GPU) Market Size and Growth Rate of Media and Entertainment (2018-2023)
-
Figure China Graphics Processing Unit (GPU) Market Size and Growth Rate of IT & Telecom (2018-2023)
-
Figure China Graphics Processing Unit (GPU) Market Size and Growth Rate of Defense and Intelligence (2018-2023)
-
Figure China Graphics Processing Unit (GPU) Market Size and Growth Rate of Electronic (2018-2023)
-
Figure China Graphics Processing Unit (GPU) Market Size and Growth Rate of Automobile (2018-2023)
-
Table China Graphics Processing Unit (GPU) Production Volume by Region (2018-2023)
-
Table China Graphics Processing Unit (GPU) Production Volume Share by Region (2018-2023)
-
Figure China Graphics Processing Unit (GPU) Production Volume Share by Region (2018-2023)
-
Table China Graphics Processing Unit (GPU) Production Value by Region (2018-2023)
-
Table China Graphics Processing Unit (GPU) Production Value Share by Region (2018-2023)
-
Figure China Graphics Processing Unit (GPU) Production Value Share by Region (2018-2023)
-
Table China Graphics Processing Unit (GPU) Sales Volume by Region (2018-2023)
-
Table China Graphics Processing Unit (GPU) Sales Volume Share by Region (2018-2023)
-
Figure China Graphics Processing Unit (GPU) Sales Volume Share by Region (2018-2023)
-
Table China Graphics Processing Unit (GPU) Sales Value by Region (2018-2023)
-
Table China Graphics Processing Unit (GPU) Sales Value Share by Region (2018-2023)
-
Figure China Graphics Processing Unit (GPU) Sales Value Share by Region (2018-2023)
-
Table North China Graphics Processing Unit (GPU) Production Volume by Type (2018-2023)
-
Table North China Graphics Processing Unit (GPU) Production Volume Share by Type (2018-2023)
-
Figure North China Graphics Processing Unit (GPU) Production Volume Share by Type (2018-2023)
-
Table North China Graphics Processing Unit (GPU) Sales Volume by Application (2018-2023)
-
Table North China Graphics Processing Unit (GPU) Sales Volume Share by Application (2018-2023)
-
Figure North China Graphics Processing Unit (GPU) Sales Volume Share by Application (2018-2023)
-
Table Central China Graphics Processing Unit (GPU) Production Volume by Type (2018-2023)
-
Table Central China Graphics Processing Unit (GPU) Production Volume Share by Type (2018-2023)
-
Figure Central China Graphics Processing Unit (GPU) Production Volume Share by Type (2018-2023)
-
Table Central China Graphics Processing Unit (GPU) Sales Volume by Application (2018-2023)
-
Table Central China Graphics Processing Unit (GPU) Sales Volume Share by Application (2018-2023)
-
Figure Central China Graphics Processing Unit (GPU) Sales Volume Share by Application (2018-2023)
-
Table South China Graphics Processing Unit (GPU) Production Volume by Type (2018-2023)
-
Table South China Graphics Processing Unit (GPU) Production Volume Share by Type (2018-2023)
-
Figure South China Graphics Processing Unit (GPU) Production Volume Share by Type (2018-2023)
-
Table South China Graphics Processing Unit (GPU) Sales Volume by Application (2018-2023)
-
Table South China Graphics Processing Unit (GPU) Sales Volume Share by Application (2018-2023)
-
Figure South China Graphics Processing Unit (GPU) Sales Volume Share by Application (2018-2023)
-
Table East China Graphics Processing Unit (GPU) Production Volume by Type (2018-2023)
-
Table East China Graphics Processing Unit (GPU) Production Volume Share by Type (2018-2023)
-
Figure East China Graphics Processing Unit (GPU) Production Volume Share by Type (2018-2023)
-
Table East China Graphics Processing Unit (GPU) Sales Volume by Application (2018-2023)
-
Table East China Graphics Processing Unit (GPU) Sales Volume Share by Application (2018-2023)
-
Figure East China Graphics Processing Unit (GPU) Sales Volume Share by Application (2018-2023)
-
Table Northeast China Graphics Processing Unit (GPU) Production Volume by Type (2018-2023)
-
Table Northeast China Graphics Processing Unit (GPU) Production Volume Share by Type (2018-2023)
-
Figure Northeast China Graphics Processing Unit (GPU) Production Volume Share by Type (2018-2023)
-
Table Northeast China Graphics Processing Unit (GPU) Sales Volume by Application (2018-2023)
-
Table Northeast China Graphics Processing Unit (GPU) Sales Volume Share by Application (2018-2023)
-
Figure Northeast China Graphics Processing Unit (GPU) Sales Volume Share by Application (2018-2023)
-
Table Southwest China Graphics Processing Unit (GPU) Production Volume by Type (2018-2023)
-
Table Southwest China Graphics Processing Unit (GPU) Production Volume Share by Type (2018-2023)
-
Figure Southwest China Graphics Processing Unit (GPU) Production Volume Share by Type (2018-2023)
-
Table Southwest China Graphics Processing Unit (GPU) Sales Volume by Application (2018-2023)
-
Table Southwest China Graphics Processing Unit (GPU) Sales Volume Share by Application (2018-2023)
-
Figure Southwest China Graphics Processing Unit (GPU) Sales Volume Share by Application (2018-2023)
-
Table Northwest China Graphics Processing Unit (GPU) Production Volume by Type (2018-2023)
-
Table Northwest China Graphics Processing Unit (GPU) Production Volume Share by Type (2018-2023)
-
Figure Northwest China Graphics Processing Unit (GPU) Production Volume Share by Type (2018-2023)
-
Table Northwest China Graphics Processing Unit (GPU) Sales Volume by Application (2018-2023)
-
Table Northwest China Graphics Processing Unit (GPU) Sales Volume Share by Application (2018-2023)
-
Figure Northwest China Graphics Processing Unit (GPU) Sales Volume Share by Application (2018-2023)
-
Table Samsung Electronics Co Ltd Company Profile
-
Table Samsung Electronics Co Ltd Graphics Processing Unit (GPU) Revenue, Price and Gross (2018-2023)
-
Table ARM Holdings Plc Company Profile
-
Table ARM Holdings Plc Graphics Processing Unit (GPU) Revenue, Price and Gross (2018-2023)
-
Table Intel Corporation Company Profile
-
Table Intel Corporation Graphics Processing Unit (GPU) Revenue, Price and Gross (2018-2023)
-
Table Jinjia MICRO Company Profile
-
Table Jinjia MICRO Graphics Processing Unit (GPU) Revenue, Price and Gross (2018-2023)
-
Table Apple Company Profile
-
Table Apple Graphics Processing Unit (GPU) Revenue, Price and Gross (2018-2023)
-
Table Taiwan Advanced Micro Devices Inc Company Profile
-
Table Taiwan Advanced Micro Devices Inc Graphics Processing Unit (GPU) Revenue, Price and Gross (2018-2023)
-
Table Qualcomm Company Profile
-
Table Qualcomm Graphics Processing Unit (GPU) Revenue, Price and Gross (2018-2023)
-
Table Imagination Technologies Company Profile
-
Table Imagination Technologies Graphics Processing Unit (GPU) Revenue, Price and Gross (2018-2023)
-
Table Alphabet Inc Company Profile
-
Table Alphabet Inc Graphics Processing Unit (GPU) Revenue, Price and Gross (2018-2023)
-
Table Gigabyte Technology Co Ltd Company Profile
-
Table Gigabyte Technology Co Ltd Graphics Processing Unit (GPU) Revenue, Price and Gross (2018-2023)
-