Chinese
- REPORT SUMMARY
- TABLE OF CONTENTS
-
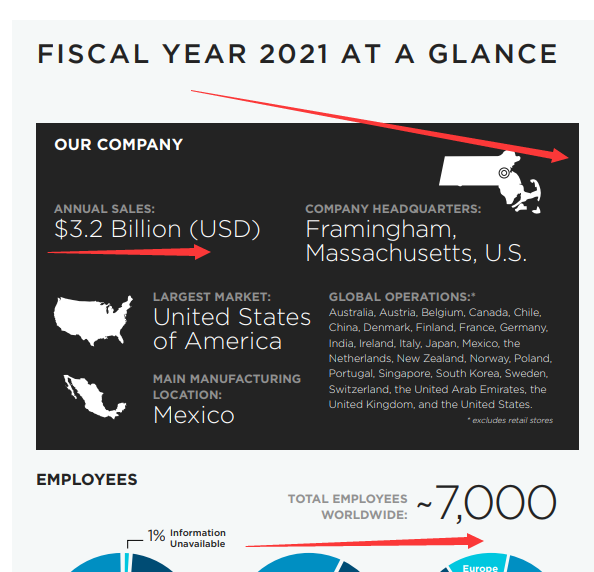
Bose, D&B audiotechnik, L-acoustic, Devialet and Focal are the five key players in the global ProAudio PA Systems market. These companies have shown consistent growth in revenue, larger volumes of sales and a prominent presence in terms of share in the global ProAudio PA Systems market in the past 5 years. Bose Corporation is an American manufacturing company that predominantly sells audio equipment. The company was established by Amar Bose in 1964 and is based in Framingham, Massachusetts. Bose is best known for its home audio systems and speakers, noise-cancelling headphones, professional audio products and automobile sound systems. D&B audiotechnik is a German loudspeaker and amplifier manufacturer. D&B provides professional audio solutions to accurately transfer passions through high-end quality speech and music reproduction. D&B is internationally regarded as a leading company for sound reinforcement systems in installed and mobile applications, with a reputation for quality of construction, standard of service, system integration principles, and pioneering technological development. Founded in Germany in 1981, company headquarters are located in Backnang, near Stuttgart, where research, development and production take place.
This report elaborates on the current development of the ProAudio PA Systems industry thoroughly based on the international market dynamics and China's market situation.
For a start, the report provides an in-depth analysis of the current market situation through three different aspects - by region, by type and by application, which includes market distribution of different types and applications, import and export analysis of major regions, development trends of different types of products in each region, market opportunities and market restrains of different applications.
Secondly, this report lists the major players in the industry, displaying their market positions and strengths and weaknesses of their products, picturing the current competitive situation of the whole market.
Last but not least, the report analyzes and predicts the investment prospects and risks in the industry on the basis of industry data, combined with experts' opinions and suggestions.
By Player:
Bose
Focal
L-acoustic
Devialet
Void Acoustics
By Type:
Critical Systems
Non-critical Systems
By Application:
Outdoor
Indoor
By Research Region:
-
North China
-
Central China
-
South China
-
East China
-
Northeast China
-
Southwest China
-
Northwest China
TABLE OF CONTENT
Chapter 1 China ProAudio PA Systems Market Overview 2018-2029
-
1.1 China ProAudio PA Systems Industry Development Overview
-
1.2 China ProAudio PA Systems Industry Development History
-
1.3 China ProAudio PA Systems Industry Market Size (2018-2029)
-
1.4 China ProAudio PA Systems Market Analysis by Type from Production Side
-
1.4.1 China ProAudio PA Systems Production Volume, Production Value and Growth Rate of Critical Systems (2018-2029)
-
1.4.2 China ProAudio PA Systems Production Volume, Production Value and Growth Rate of Non-critical Systems (2018-2029)
-
1.5 China ProAudio PA Systems Market Analysis by Application from Consumption End
-
1.5.1 China ProAudio PA Systems Sales Volume, Sales Value and Growth Rate of Outdoor (2018-2029)
-
1.5.2 China ProAudio PA Systems Sales Volume, Sales Value and Growth Rate of Indoor (2018-2029)
-
1.6 China ProAudio PA Systems Market Analysis by Region
-
1.6.1 North China ProAudio PA Systems Market Size and Growth Rate from 2018-2029
-
1.6.2 Central China ProAudio PA Systems Market Size and Growth Rate from 2018-2029
-
1.6.3 South China ProAudio PA Systems Market Size and Growth Rate from 2018-2029
-
1.6.4 East China ProAudio PA Systems Market Size and Growth Rate from 2018-2029
-
1.6.5 Northeast China ProAudio PA Systems Market Size and Growth Rate from 2018-2029
-
1.6.6 Southwest China ProAudio PA Systems Market Size and Growth Rate from 2018-2029
-
1.6.7 Northwest China ProAudio PA Systems Market Size and Growth Rate from 2018-2029
Chapter 2 China ProAudio PA Systems Industry Development Environment
-
2.1 Industry Development Environment Analysis
-
2.1.1 Industry Technological Progress Analysis
-
2.1.2 Industrial Organizational Innovation Analysis
-
2.1.3 Changes in Social Habits
-
2.1.4 Alterations in Government Policies
-
2.1.5 Impact of Economic Globalization
-
2.2 Domestic and Foreign Industry Competition Analysis
-
2.2.1 Comparative Analysis on ProAudio PA Systems Market Status and Competition at home and abroad in 2023
-
2.2.2 China ProAudio PA Systems Market Status and Competition Analysis in 2023
-
2.2.3 China ProAudio PA Systems Market Concentration Analysis in 2023
-
2.3 Problems and Countermeasures in the development of China ProAudio PA Systems Industry
-
2.3.1 Industry Development Constraints
-
2.3.2 Industry Development Considerations
-
2.3.3 Suggestions on Industry Development Measures
-
2.3.4 Development Strategies for SMEs
-
2.4 Influence of COVID-19 Outbreak on ProAudio PA Systems Industry Development
Chapter 3 ProAudio PA SystemsIndustry Chain Analysis
-
3.1 ProAudio PA Systems Industry Chain
-
3.2 ProAudio PA Systems Upstream Industry Analysis
-
3.2.1 Upstream Industry Development Status
-
3.2.2 Upstream Industry Development Forecast
-
3.2.3 Impact of Upstream Industry on the ProAudio PA Systems Market
-
3.3 ProAudio PA Systems Downstream Industry Analysis
-
3.3.1 Downstream Industry Development Status
-
3.3.2 Downstream Industry Development Forecast
-
3.3.3 Impact of Downstream Industry on the ProAudio PA Systems Market
Chapter 4 China ProAudio PA Systems Market, by Type
-
4.1 China ProAudio PA Systems Market Trend, by Type
-
4.2 Product Types of Major Suppliers
-
4.3 Competitive Landscape of Major Types
-
4.4 China ProAudio PA Systems Total Production Volume and Growth Rate from Production Side
-
4.5 China ProAudio PA Systems Production Volume and Growth Rate, by Type
-
4.5.1 China ProAudio PA Systems Production Volume and Growth Rate of Critical Systems
-
4.5.2 China ProAudio PA Systems Production Volume and Growth Rate of Non-critical Systems
Chapter 5 China ProAudio PA Systems Market, by Application
-
5.1 Downstream Market Overview
-
5.2 Competitive Landscape of Major Applications
-
5.3 Market Potential Analysis, by Application
-
5.4 China ProAudio PA Systems Total Market Size and Growth Rate from Consumption End
-
5.5 China ProAudio PA Systems Market Size and Growth Rate, by Application
-
5.5.1 China ProAudio PA Systems Market Size and Growth Rate of Outdoor
-
5.5.2 China ProAudio PA Systems Market Size and Growth Rate of Indoor
Chapter 6 China ProAudio PA Systems Market, by Region
-
6.1 China ProAudio PA Systems Production Volume and Production Value, by Region
-
6.2 China ProAudio PA Systems Sales Volume and Sales Value, by Region
Chapter 7 North China ProAudio PA Systems Market Analysis
-
7.1 North China ProAudio PA Systems Market, by Type
-
7.2 North China ProAudio PA Systems Market, by Application
Chapter 8 Central China ProAudio PA Systems Market Analysis
-
8.1 Central China ProAudio PA Systems Market, by Type
-
8.2 Central China ProAudio PA Systems Market, by Application
Chapter 9 South China ProAudio PA Systems Market Analysis
-
9.1 South China ProAudio PA Systems Market, by Type
-
9.2 South China ProAudio PA Systems Market, by Application
Chapter 10 East China ProAudio PA Systems Market Analysis
-
10.1 East China ProAudio PA Systems Market, by Type
-
10.2 East China ProAudio PA Systems Market, by Application
Chapter 11 Northeast China ProAudio PA Systems Market Analysis
-
11.1 Northeast China ProAudio PA Systems Market, by Type
-
11.2 Northeast China ProAudio PA Systems Market, by Application
Chapter 12 Southwest China ProAudio PA Systems Market Analysis
-
12.1 Southwest China ProAudio PA Systems Market, by Type
-
12.2 Southwest China ProAudio PA Systems Market, by Application
Chapter 13 Northwest China ProAudio PA Systems Market Analysis
-
13.1 Northwest China ProAudio PA Systems Market, by Type
-
13.2 Northwest China ProAudio PA Systems Market, by Application
Chapter 14 Company Profiles
-
14.1 Bose
-
14.1.1 Bose Company Profile
-
14.1.2 Bose ProAudio PA Systems Market Performance
-
14.1.3 Product&Service Introduction
-
14.2 Focal
-
14.2.1 Focal Company Profile
-
14.2.2 Focal ProAudio PA Systems Market Performance
-
14.2.3 Product&Service Introduction
-
14.3 L-acoustic
-
14.3.1 L-acoustic Company Profile
-
14.3.2 L-acoustic ProAudio PA Systems Market Performance
-
14.3.3 Product&Service Introduction
-
14.4 Devialet
-
14.4.1 Devialet Company Profile
-
14.4.2 Devialet ProAudio PA Systems Market Performance
-
14.4.3 Product&Service Introduction
-
14.5 Void Acoustics
-
14.5.1 Void Acoustics Company Profile
-
14.5.2 Void Acoustics ProAudio PA Systems Market Performance
-
14.5.3 Product&Service Introduction
Chapter 15 Research Conclusions and Investment Suggestions
-
15.1 ProAudio PA Systems Industry Research Conclusions
-
15.2 ProAudio PA Systems Industry Investment Suggestions
-
15.2.1 Suggestions on Industry Development Strategy
-
15.2.2 Suggestions on Industry Investment Direction
-
15.2.3 Suggestions on Industry Investment Strategy
List of Tables and Figures
-
Figure China ProAudio PA Systems Industry Market Size (2018-2029)
-
Figure China ProAudio PA Systems Production Volume, Production Value and Growth Rate of Critical Systems (2018-2029)
-
Figure China ProAudio PA Systems Production Volume, Production Value and Growth Rate of Non-critical Systems (2018-2029)
-
Figure China ProAudio PA Systems Sales Volume, Sales Value and Growth Rate of Outdoor (2018-2029)
-
Figure China ProAudio PA Systems Sales Volume, Sales Value and Growth Rate of Indoor (2018-2029)
-
Figure North China ProAudio PA Systems Market Size and Growth Rate from 2018-2029
-
Figure Central China ProAudio PA Systems Market Size and Growth Rate from 2018-2029
-
Figure South China ProAudio PA Systems Market Size and Growth Rate from 2018-2029
-
Figure East China ProAudio PA Systems Market Size and Growth Rate from 2018-2029
-
Figure Northeast China ProAudio PA Systems Market Size and Growth Rate from 2018-2029
-
Figure Southwest China ProAudio PA Systems Market Size and Growth Rate from 2018-2029
-
Figure Northwest China ProAudio PA Systems Market Size and Growth Rate from 2018-2029
-
Figure ProAudio PA Systems Industry Chain
-
Table Product Types of Major Suppliers in 2023
-
Figure China ProAudio PA Systems Market Share by Type in 2018
-
Figure China ProAudio PA Systems Market Share by Type in 2023
-
Figure China ProAudio PA Systems Total Production Volume and Growth Rate from Production Side (2018-2023)
-
Figure China ProAudio PA Systems Production Volume and Growth Rate of Critical Systems (2018-2023)
-
Figure China ProAudio PA Systems Production Volume and Growth Rate of Non-critical Systems (2018-2023)
-
Figure China ProAudio PA Systems Market Share by Application in 2018
-
Figure China ProAudio PA Systems Market Share by Application in 2023
-
Figure China ProAudio PA Systems Total Market Size and Growth Rate from Consumption End
-
Figure China ProAudio PA Systems Market Size and Growth Rate of Outdoor (2018-2023)
-
Figure China ProAudio PA Systems Market Size and Growth Rate of Indoor (2018-2023)
-
Table China ProAudio PA Systems Production Volume by Region (2018-2023)
-
Table China ProAudio PA Systems Production Volume Share by Region (2018-2023)
-
Figure China ProAudio PA Systems Production Volume Share by Region (2018-2023)
-
Table China ProAudio PA Systems Production Value by Region (2018-2023)
-
Table China ProAudio PA Systems Production Value Share by Region (2018-2023)
-
Figure China ProAudio PA Systems Production Value Share by Region (2018-2023)
-
Table China ProAudio PA Systems Sales Volume by Region (2018-2023)
-
Table China ProAudio PA Systems Sales Volume Share by Region (2018-2023)
-
Figure China ProAudio PA Systems Sales Volume Share by Region (2018-2023)
-
Table China ProAudio PA Systems Sales Value by Region (2018-2023)
-
Table China ProAudio PA Systems Sales Value Share by Region (2018-2023)
-
Figure China ProAudio PA Systems Sales Value Share by Region (2018-2023)
-
Table North China ProAudio PA Systems Production Volume by Type (2018-2023)
-
Table North China ProAudio PA Systems Production Volume Share by Type (2018-2023)
-
Figure North China ProAudio PA Systems Production Volume Share by Type (2018-2023)
-
Table North China ProAudio PA Systems Sales Volume by Application (2018-2023)
-
Table North China ProAudio PA Systems Sales Volume Share by Application (2018-2023)
-
Figure North China ProAudio PA Systems Sales Volume Share by Application (2018-2023)
-
Table Central China ProAudio PA Systems Production Volume by Type (2018-2023)
-
Table Central China ProAudio PA Systems Production Volume Share by Type (2018-2023)
-
Figure Central China ProAudio PA Systems Production Volume Share by Type (2018-2023)
-
Table Central China ProAudio PA Systems Sales Volume by Application (2018-2023)
-
Table Central China ProAudio PA Systems Sales Volume Share by Application (2018-2023)
-
Figure Central China ProAudio PA Systems Sales Volume Share by Application (2018-2023)
-
Table South China ProAudio PA Systems Production Volume by Type (2018-2023)
-
Table South China ProAudio PA Systems Production Volume Share by Type (2018-2023)
-
Figure South China ProAudio PA Systems Production Volume Share by Type (2018-2023)
-
Table South China ProAudio PA Systems Sales Volume by Application (2018-2023)
-
Table South China ProAudio PA Systems Sales Volume Share by Application (2018-2023)
-
Figure South China ProAudio PA Systems Sales Volume Share by Application (2018-2023)
-
Table East China ProAudio PA Systems Production Volume by Type (2018-2023)
-
Table East China ProAudio PA Systems Production Volume Share by Type (2018-2023)
-
Figure East China ProAudio PA Systems Production Volume Share by Type (2018-2023)
-
Table East China ProAudio PA Systems Sales Volume by Application (2018-2023)
-
Table East China ProAudio PA Systems Sales Volume Share by Application (2018-2023)
-
Figure East China ProAudio PA Systems Sales Volume Share by Application (2018-2023)
-
Table Northeast China ProAudio PA Systems Production Volume by Type (2018-2023)
-
Table Northeast China ProAudio PA Systems Production Volume Share by Type (2018-2023)
-
Figure Northeast China ProAudio PA Systems Production Volume Share by Type (2018-2023)
-
Table Northeast China ProAudio PA Systems Sales Volume by Application (2018-2023)
-
Table Northeast China ProAudio PA Systems Sales Volume Share by Application (2018-2023)
-
Figure Northeast China ProAudio PA Systems Sales Volume Share by Application (2018-2023)
-
Table Southwest China ProAudio PA Systems Production Volume by Type (2018-2023)
-
Table Southwest China ProAudio PA Systems Production Volume Share by Type (2018-2023)
-
Figure Southwest China ProAudio PA Systems Production Volume Share by Type (2018-2023)
-
Table Southwest China ProAudio PA Systems Sales Volume by Application (2018-2023)
-
Table Southwest China ProAudio PA Systems Sales Volume Share by Application (2018-2023)
-
Figure Southwest China ProAudio PA Systems Sales Volume Share by Application (2018-2023)
-
Table Northwest China ProAudio PA Systems Production Volume by Type (2018-2023)
-
Table Northwest China ProAudio PA Systems Production Volume Share by Type (2018-2023)
-
Figure Northwest China ProAudio PA Systems Production Volume Share by Type (2018-2023)
-
Table Northwest China ProAudio PA Systems Sales Volume by Application (2018-2023)
-
Table Northwest China ProAudio PA Systems Sales Volume Share by Application (2018-2023)
-
Figure Northwest China ProAudio PA Systems Sales Volume Share by Application (2018-2023)
-
Table Bose Company Profile
-
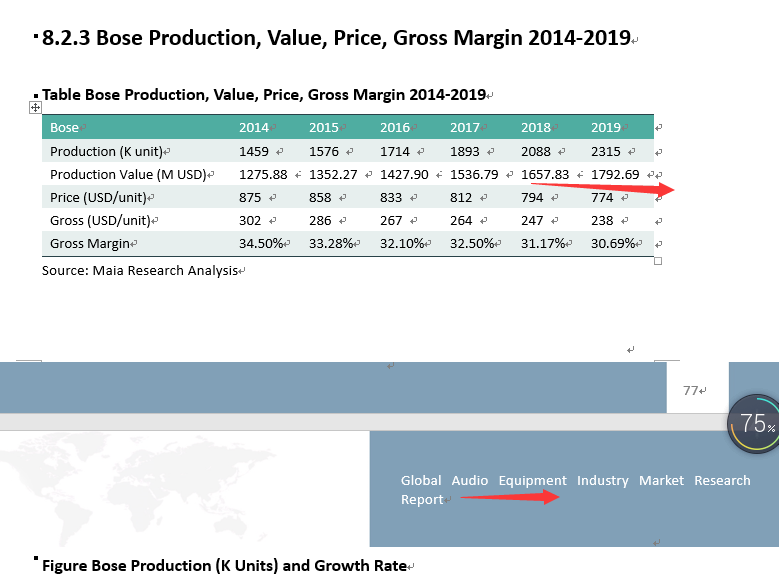
Table Bose ProAudio PA Systems Revenue, Price and Gross (2018-2023)
-
Table Focal Company Profile
-
Table Focal ProAudio PA Systems Revenue, Price and Gross (2018-2023)
-
Table L-acoustic Company Profile
-
Table L-acoustic ProAudio PA Systems Revenue, Price and Gross (2018-2023)
-
Table Devialet Company Profile
-
Table Devialet ProAudio PA Systems Revenue, Price and Gross (2018-2023)
-
Table Void Acoustics Company Profile
-
Table Void Acoustics ProAudio PA Systems Revenue, Price and Gross (2018-2023)
-