Chinese
- REPORT SUMMARY
- TABLE OF CONTENTS
-
Beer is brewed from cereal grains—most commonly from malted barley, though wheat, maize (corn), and rice are also used. During the brewing process, fermentation of the starch sugars in the wort produces ethanol and carbonation in the resulting beer.
https://www.statista.com/topics/1654/beer-production-and-distribution/
https://www.qianzhan.com/analyst/detail/220/200102-14005f9e.html
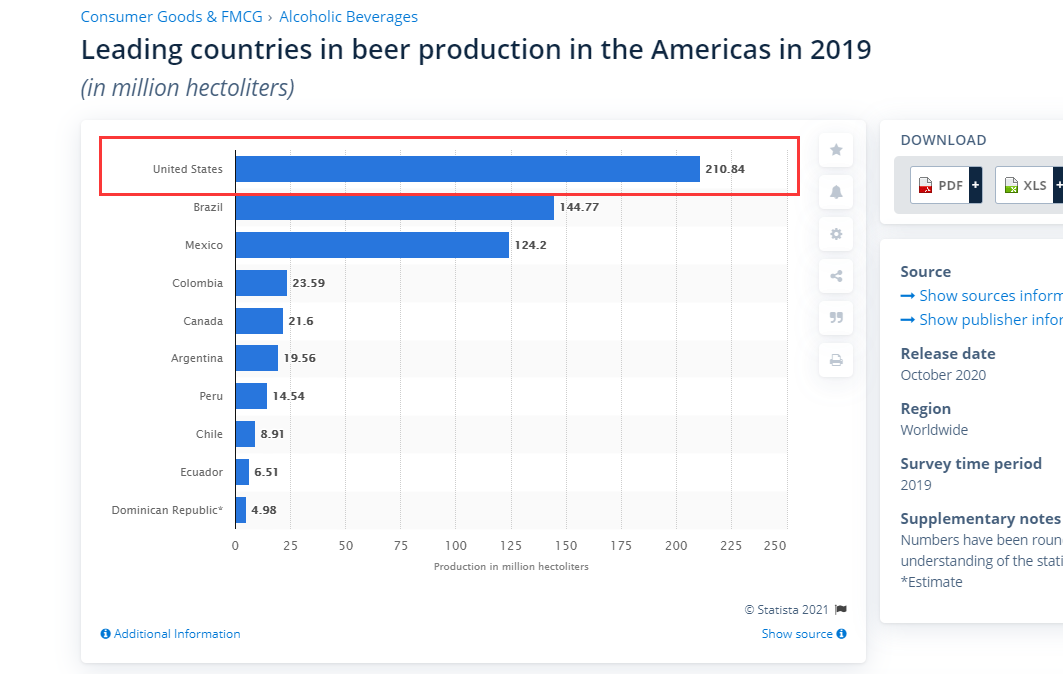
https://www.statista.com/statistics/202409/beer-production-in-different-american-countries-in-2010/
This report elaborates on the current development of the Beer industry thoroughly based on the international market dynamics and China's market situation.
For a start, the report provides an in-depth analysis of the current market situation through three different aspects - by region, by type and by application, which includes market distribution of different types and applications, import and export analysis of major regions, development trends of different types of products in each region, market opportunities and market restrains of different applications.
Secondly, this report lists the major players in the industry, displaying their market positions and strengths and weaknesses of their products, picturing the current competitive situation of the whole market.
Last but not least, the report analyzes and predicts the investment prospects and risks in the industry on the basis of industry data, combined with experts' opinions and suggestions.
By Player:
Dogfish Head Craft Brewery
New Belgium Brewing
Sierra Nevada Brewing Co
D G Yuengling & Son
Gambrinus
Anheuser-Busch InBev
Pabst
Boston Beer Company, Inc
Craft Brew Alliance
Diageo North America
Heineken USA
Constellation Brands
MillerCoors
By Type:
Malt
Others
Lager
Stout & Porter
Ale
By Application:
Others
Craft Brewery
Macro-brewery
Micro-brewery
By Research Region:
-
North China
-
Central China
-
South China
-
East China
-
Northeast China
-
Southwest China
-
Northwest China
TABLE OF CONTENT
Chapter 1 China Beer Market Overview 2018-2029
-
1.1 China Beer Industry Development Overview
-
1.2 China Beer Industry Development History
-
1.3 China Beer Industry Market Size (2018-2029)
-
1.4 China Beer Market Analysis by Type from Production Side
-
1.4.1 China Beer Production Volume, Production Value and Growth Rate of Malt (2018-2029)
-
1.4.2 China Beer Production Volume, Production Value and Growth Rate of Others (2018-2029)
-
1.4.3 China Beer Production Volume, Production Value and Growth Rate of Lager (2018-2029)
-
1.4.4 China Beer Production Volume, Production Value and Growth Rate of Stout & Porter (2018-2029)
-
1.4.5 China Beer Production Volume, Production Value and Growth Rate of Ale (2018-2029)
-
1.5 China Beer Market Analysis by Application from Consumption End
-
1.5.1 China Beer Sales Volume, Sales Value and Growth Rate of Others (2018-2029)
-
1.5.2 China Beer Sales Volume, Sales Value and Growth Rate of Craft Brewery (2018-2029)
-
1.5.3 China Beer Sales Volume, Sales Value and Growth Rate of Macro-brewery (2018-2029)
-
1.5.4 China Beer Sales Volume, Sales Value and Growth Rate of Micro-brewery (2018-2029)
-
1.6 China Beer Market Analysis by Region
-
1.6.1 North China Beer Market Size and Growth Rate from 2018-2029
-
1.6.2 Central China Beer Market Size and Growth Rate from 2018-2029
-
1.6.3 South China Beer Market Size and Growth Rate from 2018-2029
-
1.6.4 East China Beer Market Size and Growth Rate from 2018-2029
-
1.6.5 Northeast China Beer Market Size and Growth Rate from 2018-2029
-
1.6.6 Southwest China Beer Market Size and Growth Rate from 2018-2029
-
1.6.7 Northwest China Beer Market Size and Growth Rate from 2018-2029
Chapter 2 China Beer Industry Development Environment
-
2.1 Industry Development Environment Analysis
-
2.1.1 Industry Technological Progress Analysis
-
2.1.2 Industrial Organizational Innovation Analysis
-
2.1.3 Changes in Social Habits
-
2.1.4 Alterations in Government Policies
-
2.1.5 Impact of Economic Globalization
-
2.2 Domestic and Foreign Industry Competition Analysis
-
2.2.1 Comparative Analysis on Beer Market Status and Competition at home and abroad in 2023
-
2.2.2 China Beer Market Status and Competition Analysis in 2023
-
2.2.3 China Beer Market Concentration Analysis in 2023
-
2.3 Problems and Countermeasures in the development of China Beer Industry
-
2.3.1 Industry Development Constraints
-
2.3.2 Industry Development Considerations
-
2.3.3 Suggestions on Industry Development Measures
-
2.3.4 Development Strategies for SMEs
-
2.4 Influence of COVID-19 Outbreak on Beer Industry Development
Chapter 3 BeerIndustry Chain Analysis
-
3.1 Beer Industry Chain
-
3.2 Beer Upstream Industry Analysis
-
3.2.1 Upstream Industry Development Status
-
3.2.2 Upstream Industry Development Forecast
-
3.2.3 Impact of Upstream Industry on the Beer Market
-
3.3 Beer Downstream Industry Analysis
-
3.3.1 Downstream Industry Development Status
-
3.3.2 Downstream Industry Development Forecast
-
3.3.3 Impact of Downstream Industry on the Beer Market
Chapter 4 China Beer Market, by Type
-
4.1 China Beer Market Trend, by Type
-
4.2 Product Types of Major Suppliers
-
4.3 Competitive Landscape of Major Types
-
4.4 China Beer Total Production Volume and Growth Rate from Production Side
-
4.5 China Beer Production Volume and Growth Rate, by Type
-
4.5.1 China Beer Production Volume and Growth Rate of Malt
-
4.5.2 China Beer Production Volume and Growth Rate of Others
-
4.5.3 China Beer Production Volume and Growth Rate of Lager
-
4.5.4 China Beer Production Volume and Growth Rate of Stout & Porter
-
4.5.5 China Beer Production Volume and Growth Rate of Ale
Chapter 5 China Beer Market, by Application
-
5.1 Downstream Market Overview
-
5.2 Competitive Landscape of Major Applications
-
5.3 Market Potential Analysis, by Application
-
5.4 China Beer Total Market Size and Growth Rate from Consumption End
-
5.5 China Beer Market Size and Growth Rate, by Application
-
5.5.1 China Beer Market Size and Growth Rate of Others
-
5.5.2 China Beer Market Size and Growth Rate of Craft Brewery
-
5.5.3 China Beer Market Size and Growth Rate of Macro-brewery
-
5.5.4 China Beer Market Size and Growth Rate of Micro-brewery
Chapter 6 China Beer Market, by Region
-
6.1 China Beer Production Volume and Production Value, by Region
-
6.2 China Beer Sales Volume and Sales Value, by Region
Chapter 7 North China Beer Market Analysis
-
7.1 North China Beer Market, by Type
-
7.2 North China Beer Market, by Application
Chapter 8 Central China Beer Market Analysis
-
8.1 Central China Beer Market, by Type
-
8.2 Central China Beer Market, by Application
Chapter 9 South China Beer Market Analysis
-
9.1 South China Beer Market, by Type
-
9.2 South China Beer Market, by Application
Chapter 10 East China Beer Market Analysis
-
10.1 East China Beer Market, by Type
-
10.2 East China Beer Market, by Application
Chapter 11 Northeast China Beer Market Analysis
-
11.1 Northeast China Beer Market, by Type
-
11.2 Northeast China Beer Market, by Application
Chapter 12 Southwest China Beer Market Analysis
-
12.1 Southwest China Beer Market, by Type
-
12.2 Southwest China Beer Market, by Application
Chapter 13 Northwest China Beer Market Analysis
-
13.1 Northwest China Beer Market, by Type
-
13.2 Northwest China Beer Market, by Application
Chapter 14 Company Profiles
-
14.1 Dogfish Head Craft Brewery
-
14.1.1 Dogfish Head Craft Brewery Company Profile
-
14.1.2 Dogfish Head Craft Brewery Beer Market Performance
-
14.1.3 Product&Service Introduction
-
14.2 New Belgium Brewing
-
14.2.1 New Belgium Brewing Company Profile
-
14.2.2 New Belgium Brewing Beer Market Performance
-
14.2.3 Product&Service Introduction
-
14.3 Sierra Nevada Brewing Co
-
14.3.1 Sierra Nevada Brewing Co Company Profile
-
14.3.2 Sierra Nevada Brewing Co Beer Market Performance
-
14.3.3 Product&Service Introduction
-
14.4 D G Yuengling & Son
-
14.4.1 D G Yuengling & Son Company Profile
-
14.4.2 D G Yuengling & Son Beer Market Performance
-
14.4.3 Product&Service Introduction
-
14.5 Gambrinus
-
14.5.1 Gambrinus Company Profile
-
14.5.2 Gambrinus Beer Market Performance
-
14.5.3 Product&Service Introduction
-
14.6 Anheuser-Busch InBev
-
14.6.1 Anheuser-Busch InBev Company Profile
-
14.6.2 Anheuser-Busch InBev Beer Market Performance
-
14.6.3 Product&Service Introduction
-
14.7 Pabst
-
14.7.1 Pabst Company Profile
-
14.7.2 Pabst Beer Market Performance
-
14.7.3 Product&Service Introduction
-
14.8 Boston Beer Company, Inc
-
14.8.1 Boston Beer Company, Inc Company Profile
-
14.8.2 Boston Beer Company, Inc Beer Market Performance
-
14.8.3 Product&Service Introduction
-
14.9 Craft Brew Alliance
-
14.9.1 Craft Brew Alliance Company Profile
-
14.9.2 Craft Brew Alliance Beer Market Performance
-
14.9.3 Product&Service Introduction
-
14.10 Diageo North America
-
14.10.1 Diageo North America Company Profile
-
14.10.2 Diageo North America Beer Market Performance
-
14.10.3 Product&Service Introduction
-
14.11 Heineken USA
-
14.11.1 Heineken USA Company Profile
-
14.11.2 Heineken USA Beer Market Performance
-
14.11.3 Product&Service Introduction
-
14.12 Constellation Brands
-
14.12.1 Constellation Brands Company Profile
-
14.12.2 Constellation Brands Beer Market Performance
-
14.12.3 Product&Service Introduction
-
14.13 MillerCoors
-
14.13.1 MillerCoors Company Profile
-
14.13.2 MillerCoors Beer Market Performance
-
14.13.3 Product&Service Introduction
Chapter 15 Research Conclusions and Investment Suggestions
-
15.1 Beer Industry Research Conclusions
-
15.2 Beer Industry Investment Suggestions
-
15.2.1 Suggestions on Industry Development Strategy
-
15.2.2 Suggestions on Industry Investment Direction
-
15.2.3 Suggestions on Industry Investment Strategy
List of Tables and Figures
-
Figure China Beer Industry Market Size (2018-2029)
-
Figure China Beer Production Volume, Production Value and Growth Rate of Malt (2018-2029)
-
Figure China Beer Production Volume, Production Value and Growth Rate of Others (2018-2029)
-
Figure China Beer Production Volume, Production Value and Growth Rate of Lager (2018-2029)
-
Figure China Beer Production Volume, Production Value and Growth Rate of Stout & Porter (2018-2029)
-
Figure China Beer Production Volume, Production Value and Growth Rate of Ale (2018-2029)
-
Figure China Beer Sales Volume, Sales Value and Growth Rate of Others (2018-2029)
-
Figure China Beer Sales Volume, Sales Value and Growth Rate of Craft Brewery (2018-2029)
-
Figure China Beer Sales Volume, Sales Value and Growth Rate of Macro-brewery (2018-2029)
-
Figure China Beer Sales Volume, Sales Value and Growth Rate of Micro-brewery (2018-2029)
-
Figure North China Beer Market Size and Growth Rate from 2018-2029
-
Figure Central China Beer Market Size and Growth Rate from 2018-2029
-
Figure South China Beer Market Size and Growth Rate from 2018-2029
-
Figure East China Beer Market Size and Growth Rate from 2018-2029
-
Figure Northeast China Beer Market Size and Growth Rate from 2018-2029
-
Figure Southwest China Beer Market Size and Growth Rate from 2018-2029
-
Figure Northwest China Beer Market Size and Growth Rate from 2018-2029
-
Figure Beer Industry Chain
-
Table Product Types of Major Suppliers in 2023
-
Figure China Beer Market Share by Type in 2018
-
Figure China Beer Market Share by Type in 2023
-
Figure China Beer Total Production Volume and Growth Rate from Production Side (2018-2023)
-
Figure China Beer Production Volume and Growth Rate of Malt (2018-2023)
-
Figure China Beer Production Volume and Growth Rate of Others (2018-2023)
-
Figure China Beer Production Volume and Growth Rate of Lager (2018-2023)
-
Figure China Beer Production Volume and Growth Rate of Stout & Porter (2018-2023)
-
Figure China Beer Production Volume and Growth Rate of Ale (2018-2023)
-
Figure China Beer Market Share by Application in 2018
-
Figure China Beer Market Share by Application in 2023
-
Figure China Beer Total Market Size and Growth Rate from Consumption End
-
Figure China Beer Market Size and Growth Rate of Others (2018-2023)
-
Figure China Beer Market Size and Growth Rate of Craft Brewery (2018-2023)
-
Figure China Beer Market Size and Growth Rate of Macro-brewery (2018-2023)
-
Figure China Beer Market Size and Growth Rate of Micro-brewery (2018-2023)
-
Table China Beer Production Volume by Region (2018-2023)
-
Table China Beer Production Volume Share by Region (2018-2023)
-
Figure China Beer Production Volume Share by Region (2018-2023)
-
Table China Beer Production Value by Region (2018-2023)
-
Table China Beer Production Value Share by Region (2018-2023)
-
Figure China Beer Production Value Share by Region (2018-2023)
-
Table China Beer Sales Volume by Region (2018-2023)
-
Table China Beer Sales Volume Share by Region (2018-2023)
-
Figure China Beer Sales Volume Share by Region (2018-2023)
-
Table China Beer Sales Value by Region (2018-2023)
-
Table China Beer Sales Value Share by Region (2018-2023)
-
Figure China Beer Sales Value Share by Region (2018-2023)
-
Table North China Beer Production Volume by Type (2018-2023)
-
Table North China Beer Production Volume Share by Type (2018-2023)
-
Figure North China Beer Production Volume Share by Type (2018-2023)
-
Table North China Beer Sales Volume by Application (2018-2023)
-
Table North China Beer Sales Volume Share by Application (2018-2023)
-
Figure North China Beer Sales Volume Share by Application (2018-2023)
-
Table Central China Beer Production Volume by Type (2018-2023)
-
Table Central China Beer Production Volume Share by Type (2018-2023)
-
Figure Central China Beer Production Volume Share by Type (2018-2023)
-
Table Central China Beer Sales Volume by Application (2018-2023)
-
Table Central China Beer Sales Volume Share by Application (2018-2023)
-
Figure Central China Beer Sales Volume Share by Application (2018-2023)
-
Table South China Beer Production Volume by Type (2018-2023)
-
Table South China Beer Production Volume Share by Type (2018-2023)
-
Figure South China Beer Production Volume Share by Type (2018-2023)
-
Table South China Beer Sales Volume by Application (2018-2023)
-
Table South China Beer Sales Volume Share by Application (2018-2023)
-
Figure South China Beer Sales Volume Share by Application (2018-2023)
-
Table East China Beer Production Volume by Type (2018-2023)
-
Table East China Beer Production Volume Share by Type (2018-2023)
-
Figure East China Beer Production Volume Share by Type (2018-2023)
-
Table East China Beer Sales Volume by Application (2018-2023)
-
Table East China Beer Sales Volume Share by Application (2018-2023)
-
Figure East China Beer Sales Volume Share by Application (2018-2023)
-
Table Northeast China Beer Production Volume by Type (2018-2023)
-
Table Northeast China Beer Production Volume Share by Type (2018-2023)
-
Figure Northeast China Beer Production Volume Share by Type (2018-2023)
-
Table Northeast China Beer Sales Volume by Application (2018-2023)
-
Table Northeast China Beer Sales Volume Share by Application (2018-2023)
-
Figure Northeast China Beer Sales Volume Share by Application (2018-2023)
-
Table Southwest China Beer Production Volume by Type (2018-2023)
-
Table Southwest China Beer Production Volume Share by Type (2018-2023)
-
Figure Southwest China Beer Production Volume Share by Type (2018-2023)
-
Table Southwest China Beer Sales Volume by Application (2018-2023)
-
Table Southwest China Beer Sales Volume Share by Application (2018-2023)
-
Figure Southwest China Beer Sales Volume Share by Application (2018-2023)
-
Table Northwest China Beer Production Volume by Type (2018-2023)
-
Table Northwest China Beer Production Volume Share by Type (2018-2023)
-
Figure Northwest China Beer Production Volume Share by Type (2018-2023)
-
Table Northwest China Beer Sales Volume by Application (2018-2023)
-
Table Northwest China Beer Sales Volume Share by Application (2018-2023)
-
Figure Northwest China Beer Sales Volume Share by Application (2018-2023)
-
Table Dogfish Head Craft Brewery Company Profile
-
Table Dogfish Head Craft Brewery Beer Revenue, Price and Gross (2018-2023)
-
Table New Belgium Brewing Company Profile
-
Table New Belgium Brewing Beer Revenue, Price and Gross (2018-2023)
-
Table Sierra Nevada Brewing Co Company Profile
-
Table Sierra Nevada Brewing Co Beer Revenue, Price and Gross (2018-2023)
-
Table D G Yuengling & Son Company Profile
-
Table D G Yuengling & Son Beer Revenue, Price and Gross (2018-2023)
-
Table Gambrinus Company Profile
-
Table Gambrinus Beer Revenue, Price and Gross (2018-2023)
-
Table Anheuser-Busch InBev Company Profile
-
Table Anheuser-Busch InBev Beer Revenue, Price and Gross (2018-2023)
-
Table Pabst Company Profile
-
Table Pabst Beer Revenue, Price and Gross (2018-2023)
-
Table Boston Beer Company, Inc Company Profile
-
Table Boston Beer Company, Inc Beer Revenue, Price and Gross (2018-2023)
-
Table Craft Brew Alliance Company Profile
-
Table Craft Brew Alliance Beer Revenue, Price and Gross (2018-2023)
-
Table Diageo North America Company Profile
-
Table Diageo North America Beer Revenue, Price and Gross (2018-2023)
-
Table Heineken USA Company Profile
-
Table Heineken USA Beer Revenue, Price and Gross (2018-2023)
-
Table Constellation Brands Company Profile
-
Table Constellation Brands Beer Revenue, Price and Gross (2018-2023)
-
Table MillerCoors Company Profile
-
Table MillerCoors Beer Revenue, Price and Gross (2018-2023)
-