Chinese
- REPORT SUMMARY
- TABLE OF CONTENTS
-
3D glass is a hard and brittle material that has the advantages of high appearance, good touch, lightness and thinness, and is mainly used in the field of smart phones. In the context of 5G commercialization, the high-end development of smart phones has increased the requirements for electromagnetic shielding of mobile phone covers, and metal covers have gradually been eliminated. Materials such as glass and ceramics have no effect on electromagnetic shielding, so application requirements are higher. Compared with ceramic materials, 3D glass has a higher cost performance, so the application demand in high-end mobile phones is higher. With the growth of 5G mobile phone shipments, the 3D glass industry has developed rapidly.
Market Penetration Rate Continues to Rise, Entering Multiple Industries
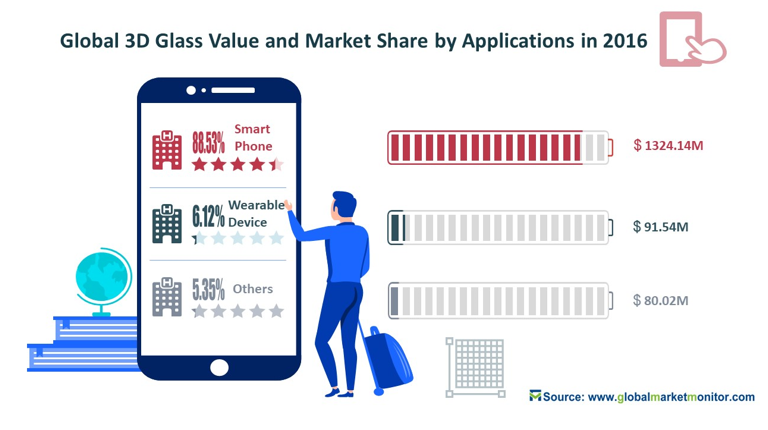
3D curved glass is mainly used in smart phones, wearable devices, tablet computers and other fields. Among them, smart phones are the main application areas of 3D glass, accounting for 88.53% of the 3D glass application market. With the development of high-end smartphones, mobile phone brands have adopted 3D glass as their mobile phone cover in pursuit of aesthetics and high cost performance. Therefore, the penetration rate of 3D glass in smartphones has continued to increase. In addition to smart phones, with the advancement of 3D glass technology, lower costs, and the continuous improvement of its application technology, 3D glass will be applied in many fields such as wearable devices and automobiles, and the development prospects of the 3D glass industry are better.
In the past two years, the global smartphone market where 3D glass is frequently used has been on an upward slope. The design trend of smartphones involves curved screens, full screens, folding screens, and double 3D glass front and rear, which will steadily promote the demand for 3D glass. The launch of 5G mobile phones will encourage consumers to buy new mobile phones, which is a real boon for the 3D glass market. In 2019, the penetration rate of 3D glass in the global smartphone market was 17.5%, and it is expected to reach 52.8% in 2026. The AMOLED panels used in wearable devices such as smart watches and bracelets have a huge demand for 3D glass, with a market penetration rate of 50.3% in 2019. In addition to smart phones and wearable devices, many other industries are also applying 3D glass, such as the automotive industry. The automobile industry uses 3D glass to make touch-screen displays inside cars, which has greatly promoted the rapid development of 3D glass.
3D Glass Back Cover Is Difficult to Surpass 3D Glass Display
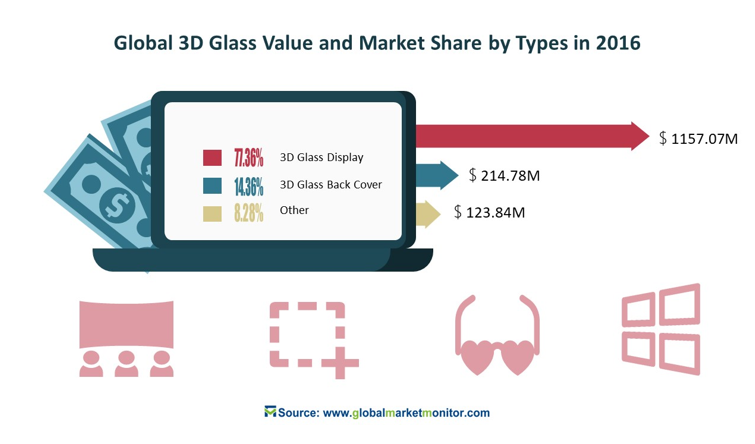
3D glass is mainly divided into two categories, one is 3D glass display, and the other is 3D glass back cover. Among them, 3D glass display account for about 80% of the entire 3D glass market, and 3D glass back cover account for about 10%. Computers, TVs, mobile phones and other smart electronic devices are inseparable from displays, and 3D glass has become the preferred material in these fields due to its superior performance. In 2016, the market value of 3D glass display was close to 1.2 billion US dollars. As the demand and quality of electronic equipment increase in the future, this value will continue to rise.
3D glass back cover are mainly used on smartphones. As the penetration rate of 3D glass in the field of smartphones continues to increase, more and more mobile phones use 3D glass back cover. Smart phones continue to innovate, and together with the promotion of the innovation and quality improvement of 3D glass back cover, the market share of 3D glass back cover will continue to increase in the future, but there is little hope that the market share of 3D glass back cover will exceed the market share of 3D glass display in the short term.
China Is Undoubtedly the Overlord of the 3D Glass Market
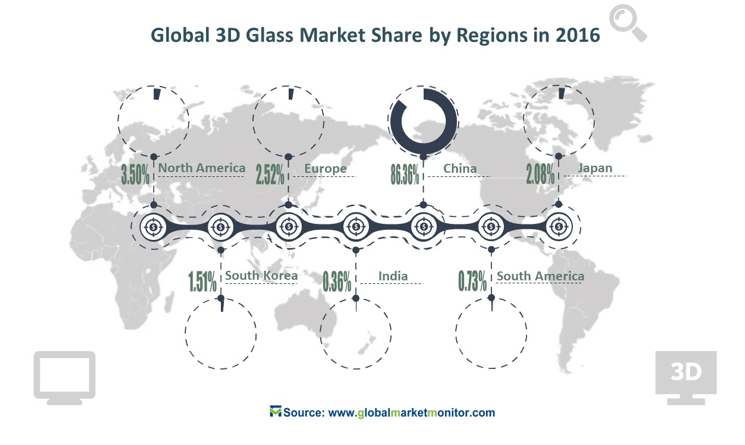
China is undoubtedly the world's largest market for 3D glass. The world's top 3D glass producers are all in China, and the Chinese government vigorously supports the 3D glass industry and has successively issued a series of policies to promote the development of the 3D glass industry in China and the world. As the second and third largest 3D glass markets in the world, Europe and North America have the world’s top high-tech talents and good economic development prospects. Although the 3D glass industry in Europe and North America is not as large as the Chinese market, the industry chain has been trending to mature. The mature experience and materials of 3D glass are mainly in Japan, South Korea and other countries. With technical advantages and good quality, Japanese and Korean 3D glass bending machines occupy a dominant position in the market. The Middle East, India, and Africa are all blue ocean markets for 3D glass. The integration of global trade has driven these slightly underdeveloped countries and promoted the consumption and demand for 3D glass in these countries. India has ample labor and low labor prices. In the future, companies may set up their factories in India to promote the development of the 3D glass market in India. South America is the region with the fastest growing demand for 3D glass in the world. All countries in South America are developing countries and are in a stage of rapid economic growth. The import demand for 3D glass continues to rise.
The global 3D glass market is dominated by some Chinese companies, including Biel Crystal, BYD Electronics, and Lens Technology. As the application of 3D glass becomes more and more widespread, the market prospects are relatively optimistic. Typical 3D glass manufacturers such as some corporate BOE and WG technologies are expanding their production capacity, hoping to seize the market through this method. As a global leader in semiconductor displays, BOE and JNTC have established a joint venture BJN. As one of Samsung's main 3D cover glass suppliers, they have developed the 3D glass cover business and have a strong influence in the 3D glass market. In the future, 3D glass will become very common and become a strong industry in the world.
Table of Contents
1 Report Overview
-
1.1 Product Definition and Scope
-
1.2 PEST (Political, Economic, Social and Technological) Analysis of 3D Glass Market
-
1.3 Market Segmentation by Type
-
1.3.1 Global 3D Glass Market Size and Growth Rate of 3D Glass Display from 2014 to 2026
-
1.3.2 Global 3D Glass Market Size and Growth Rate of 3D Glass Back Cover from 2014 to 2026
-
1.3.3 Global 3D Glass Market Size and Growth Rate of Others from 2014 to 2026
-
1.4 Market Segmentation by End-Users
-
1.4.1 Global 3D Glass Market Size and Growth Rate of Smart Phone from 2014 to 2026
-
1.4.2 Global 3D Glass Market Size and Growth Rate of Wearable Device from 2014 to 2026
-
1.4.3 Global 3D Glass Market Size and Growth Rate of Others from 2014 to 2026
-
1.5 Market Segmentation by Regions
-
1.5.1 North America 3D Glass Market Size and Growth Rate from 2014 to 2026
-
1.5.1.1 United States 3D Glass Market Size and Growth Rate from 2014 to 2026
-
1.5.1.2 Canada 3D Glass Market Size and Growth Rate from 2014 to 2026
-
1.5.1.3 Mexico 3D Glass Market Size and Growth Rate from 2014 to 2026
-
1.5.2 Europe 3D Glass Market Size and Growth Rate from 2014 to 2026
-
1.5.2.1 Germany 3D Glass Market Size and Growth Rate from 2014 to 2026
-
1.5.2.2 UK 3D Glass Market Size and Growth Rate from 2014 to 2026
-
1.5.2.3 France 3D Glass Market Size and Growth Rate from 2014 to 2026
-
1.5.2.4 Italy 3D Glass Market Size and Growth Rate from 2014 to 2026
-
1.5.2.5 Nordic Countries 3D Glass Market Size and Growth Rate from 2014 to 2026
-
1.5.2.6 Spain 3D Glass Market Size and Growth Rate from 2014 to 2026
-
1.5.2.7 Belgium 3D Glass Market Size and Growth Rate from 2014 to 2026
-
1.5.2.8 Poland 3D Glass Market Size and Growth Rate from 2014 to 2026
-
1.5.2.9 Russia 3D Glass Market Size and Growth Rate from 2014 to 2026
-
1.5.2.10 Turkey 3D Glass Market Size and Growth Rate from 2014 to 2026
-
1.5.3 Asia-Pacific 3D Glass Market Size and Growth Rate from 2014 to 2026
-
1.5.3.1 China 3D Glass Market Size and Growth Rate from 2014 to 2026
-
1.5.3.2 Japan 3D Glass Market Size and Growth Rate from 2014 to 2026
-
1.5.3.3 Australia and New Zealand 3D Glass Market Size and Growth Rate from 2014 to 2026
-
1.5.3.4 India 3D Glass Market Size and Growth Rate from 2014 to 2026
-
1.5.3.5 ASEAN Countries 3D Glass Market Size and Growth Rate from 2014 to 2026
-
1.5.3.6 South Korea 3D Glass Market Size and Growth Rate from 2014 to 2026
-
1.5.4 Latin America, Middle East & Africa 3D Glass Market Size and Growth Rate from 2014 to 2026
-
1.5.4.1 GCC Countries 3D Glass Market Size and Growth Rate from 2014 to 2026
-
1.5.4.2 Brazil 3D Glass Market Size and Growth Rate from 2014 to 2026
-
1.5.4.3 Nigeria 3D Glass Market Size and Growth Rate from 2014 to 2026
-
1.5.4.4 South Africa 3D Glass Market Size and Growth Rate from 2014 to 2026
-
1.5.4.5 Argentina 3D Glass Market Size and Growth Rate from 2014 to 2026
2 Market Trends and Competitive Landscape
-
2.1 Market Trends and Dynamics
-
2.1.1 Market Challenges and Restraints
-
2.1.2 Market Opportunities and Potentials
-
2.1.3 Mergers and Acquisitions
-
2.2 Competitive Landscape Analysis
-
2.2.1 Industrial Concentration Analysis
-
2.2.2 Porter's Five Forces Analysis of the Industry
-
2.2.3 SWOT Analysis for New Entrants
3 Segmentation of 3D Glass Market by Types
-
3.1 Product Development Trends of Different Types
-
3.2 Commercial Product Types of Major Vendors
-
3.3 Competitive Landscape Analysis of Different Types
-
3.4 Market Size of 3D Glass by Major Types
-
3.4.1 3D Glass Market Size and Growth Rate of 3D Glass Display
-
3.4.2 3D Glass Market Size and Growth Rate of 3D Glass Back Cover
-
3.4.3 3D Glass Market Size and Growth Rate of Others
4 Segmentation of 3D Glass Market by End-Users
-
4.1 Downstream Client Analysis by End-Users
-
4.2 Competitive Landscape Analysis of Different End-Users
-
4.3 Market Potential Analysis of Different End-Users
-
4.4 Market Size of 3D Glass by Major End-Users
-
4.4.1 Market Size and Growth Rate of 3D Glass in Smart Phone
-
4.4.2 Market Size and Growth Rate of 3D Glass in Wearable Device
-
4.4.3 Market Size and Growth Rate of 3D Glass in Others
5 Market Analysis by Major Regions
-
5.1 Global 3D Glass Production Analysis by Major Regions
-
5.2 Global 3D Glass Consumption Analysis by Major Regions
-
5.3 Global 3D Glass Production, Import, Consumption and Export Analysis by Regions
-
5.3.1 North America 3D Glass Production, Import, Consumption and Export Analysis
-
5.3.2 Europe 3D Glass Production, Import, Consumption and Export Analysis
-
5.3.3 Asia Pacific 3D Glass Production, Import, Consumption and Export Analysis
-
5.3.4 Latin America, Middle East & Africa 3D Glass Production, Import, Consumption and Export Analysis
6 Product Commodity of 3D Glass Market in Major Countries
-
6.1 Top 5 Export Countries in 3D Glass market from 2014 to 2019
-
6.1.1 Top 5 Export Countries' Export Value Analysis in 3D Glass market from 2014 to 2019
-
6.1.2 Top 5 Export Countries' Export Volume Analysis in 3D Glass market from 2014 to 2019
-
6.2 Top 5 Import Countries in 3D Glass market from 2014 to 2019
-
6.2.1 Top 5 Import Countries' Import Value Analysis in 3D Glass market from 2014 to 2019
-
6.2.2 Top 5 Import Countries' Import Volume Analysis in 3D Glass market from 2014 to 2019
-
6.3 Emerging Top 3 Export Countries Analysis
-
6.4 Emerging Top 3 Import Countries Analysis
7 North America 3D Glass Landscape Analysis
-
7.1 North America 3D Glass Landscape Analysis by Major Types
-
7.2 North America 3D Glass Landscape Analysis by Major End-Users
-
7.3 North America 3D Glass Landscape Analysis by Major Countries
-
7.3.1 United States 3D Glass Market Volume and Growth Rate
-
7.3.2 Canada 3D Glass Market Volume and Growth Rate
-
7.3.3 Mexico 3D Glass Market Volume and Growth Rate
8 Europe 3D Glass Landscape Analysis
-
8.1 Europe 3D Glass Landscape Analysis by Major Types
-
8.2 Europe 3D Glass Landscape Analysis by Major End-Users
-
8.3 Europe 3D Glass Landscape Analysis by Major Countries
-
8.3.1 Germany 3D Glass Market Volume and Growth Rate
-
8.3.2 UK 3D Glass Market Volume and Growth Rate
-
8.3.3 France 3D Glass Market Volume and Growth Rate
-
8.3.4 Italy 3D Glass Market Volume and Growth Rate
-
8.3.5 Nordic Countries 3D Glass Market Volume and Growth Rate
-
8.3.6 Spain 3D Glass Market Volume and Growth Rate
-
8.3.7 Belgium 3D Glass Market Volume and Growth Rate
-
8.3.8 Poland 3D Glass Market Volume and Growth Rate
-
8.3.9 Russia 3D Glass Market Volume and Growth Rate
-
8.3.10 Turkey 3D Glass Market Volume and Growth Rate
9 Asia Pacific 3D Glass Landscape Analysis
-
9.1 Asia Pacific 3D Glass Landscape Analysis by Major Types
-
9.2 Asia Pacific 3D Glass Landscape Analysis by Major End-Users
-
9.3 Asia Pacific 3D Glass Landscape Analysis by Major Countries
-
9.3.1 China 3D Glass Market Volume and Growth Rate
-
9.3.2 Japan 3D Glass Market Volume and Growth Rate
-
9.3.3 Australia and New Zealand 3D Glass Market Volume and Growth Rate
-
9.3.4 India 3D Glass Market Volume and Growth Rate
-
9.3.5 ASEAN Countries 3D Glass Market Volume and Growth Rate
-
9.3.6 South Korea 3D Glass Market Volume and Growth Rate
10 Latin America, Middle East & Africa 3D Glass Landscape Analysis
-
10.1 Latin America, Middle East & Africa 3D Glass Landscape Analysis by Major Types
-
10.2 Latin America, Middle East & Africa 3D Glass Landscape Analysis by Major End-Users
-
10.3 Latin America, Middle East & Africa 3D Glass Landscape Analysis by Major Countries
-
10.3.1 GCC Countries 3D Glass Market Volume and Growth Rate
-
10.3.2 Brazil 3D Glass Market Volume and Growth Rate
-
10.3.3 Nigeria 3D Glass Market Volume and Growth Rate
-
10.3.4 South Africa 3D Glass Market Volume and Growth Rate
-
10.3.5 Argentina 3D Glass Market Volume and Growth Rate
11 Major Players Profile
-
11.1 LENS
-
11.1.1 LENS Company Profile and Recent Development
-
11.1.2 Market Performance
-
11.1.3 Product and Service Introduction
-
11.2 Bourne optics
-
11.2.1 Bourne optics Company Profile and Recent Development
-
11.2.2 Market Performance
-
11.2.3 Product and Service Introduction
-
11.3 CORNING
-
11.3.1 CORNING Company Profile and Recent Development
-
11.3.2 Market Performance
-
11.3.3 Product and Service Introduction
-
11.4 SCHOTT
-
11.4.1 SCHOTT Company Profile and Recent Development
-
11.4.2 Market Performance
-
11.4.3 Product and Service Introduction
-
11.5 NEG
-
11.5.1 NEG Company Profile and Recent Development
-
11.5.2 Market Performance
-
11.5.3 Product and Service Introduction
-
11.6 AGC
-
11.6.1 AGC Company Profile and Recent Development
-
11.6.2 Market Performance
-
11.6.3 Product and Service Introduction
-
11.7 First-panel
-
11.7.1 First-panel Company Profile and Recent Development
-
11.7.2 Market Performance
-
11.7.3 Product and Service Introduction
-
11.8 FOXCONN
-
11.8.1 FOXCONN Company Profile and Recent Development
-
11.8.2 Market Performance
-
11.8.3 Product and Service Introduction
-
11.9 O-film
-
11.9.1 O-film Company Profile and Recent Development
-
11.9.2 Market Performance
-
11.9.3 Product and Service Introduction
-
11.10 Holitech Technology
-
11.10.1 Holitech Technology Company Profile and Recent Development
-
11.10.2 Market Performance
-
11.10.3 Product and Service Introduction
-
11.11 KMTC
-
11.11.1 KMTC Company Profile and Recent Development
-
11.11.2 Market Performance
-
11.11.3 Product and Service Introduction
-
11.12 Gtoc
-
11.12.1 Gtoc Company Profile and Recent Development
-
11.12.2 Market Performance
-
11.12.3 Product and Service Introduction
12 Data Source and Research Methodology
The List of Tables and Figures (Totals 93 Figures and 209 Tables)
-
Figure Product Picture
-
Figure 3D Glass Market Size and Growth Rate of 3D Glass Display from 2014 to 2026
-
Figure 3D Glass Market Size and Growth Rate of 3D Glass Back Cover from 2014 to 2026
-
Figure 3D Glass Market Size and Growth Rate of Others from 2014 to 2026
-
Figure Market Share by Type in 2014
-
Figure Market Share by Type in 2018
-
Figure Market Share by Type in 2026
-
Figure Global 3D Glass Market Size and Growth Rate of Smart Phone from 2014 to 2026
-
Figure Global 3D Glass Market Size and Growth Rate of Wearable Device from 2014 to 2026
-
Figure Global 3D Glass Market Size and Growth Rate of Others from 2014 to 2026
-
Figure Market Share by End-User in 2014
-
Figure Market Share by End-User in 2018
-
Figure Market Share by End-User in 2026
-
Figure North America 3D Glass Consumption Market Size and Growth Rate from 2014 to 2026
-
Figure United States 3D Glass Consumption Market Size and Growth Rate from 2014 to 2026
-
Figure Canada 3D Glass Consumption Market Size and Growth Rate from 2014 to 2026
-
Figure Mexico 3D Glass Consumption Market Size and Growth Rate from 2014 to 2026
-
Figure Europe 3D Glass Consumption Market Size and Growth Rate from 2014 to 2026
-
Figure Germany 3D Glass Consumption Market Size and Growth Rate from 2014 to 2026
-
Figure UK 3D Glass Consumption Market Size and Growth Rate from 2014 to 2026
-
Figure France 3D Glass Consumption Market Size and Growth Rate from 2014 to 2026
-
Figure Italy 3D Glass Consumption Market Size and Growth Rate from 2014 to 2026
-
Figure Nordic Countries 3D Glass Consumption Market Size and Growth Rate from 2014 to 2026
-
Figure Spain 3D Glass Consumption Market Size and Growth Rate from 2014 to 2026
-
Figure Belgium 3D Glass Consumption Market Size and Growth Rate from 2014 to 2026
-
Figure Poland 3D Glass Consumption Market Size and Growth Rate from 2014 to 2026
-
Figure Russia 3D Glass Consumption Market Size and Growth Rate from 2014 to 2026
-
Figure Turkey 3D Glass Consumption Market Size and Growth Rate from 2014 to 2026
-
Figure Asia-Pacific 3D Glass Consumption Market Size and Growth Rate from 2014 to 2026
-
Figure China 3D Glass Consumption Market Size and Growth Rate from 2014 to 2026
-
Figure Japan 3D Glass Consumption Market Size and Growth Rate from 2014 to 2026
-
Figure Australia and New Zealand 3D Glass Consumption Market Size and Growth Rate from 2014 to 2026
-
Figure India 3D Glass Consumption Market Size and Growth Rate from 2014 to 2026
-
Figure ASEAN Countries 3D Glass Consumption Market Size and Growth Rate from 2014 to 2026
-
Figure South Korea 3D Glass Consumption Market Size and Growth Rate from 2014 to 2026
-
Figure Latin America, Middle East & Africa 3D Glass Consumption Market Size and Growth Rate from 2014 to 2026
-
Figure GCC Countries 3D Glass Consumption Market Size and Growth Rate from 2014 to 2026
-
Figure Brazil 3D Glass Consumption Market Size and Growth Rate from 2014 to 2026
-
Figure Nigeria 3D Glass Consumption Market Size and Growth Rate from 2014 to 2026
-
Figure South Africa 3D Glass Consumption Market Size and Growth Rate from 2014 to 2026
-
Figure Argentina 3D Glass Consumption Market Size and Growth Rate from 2014 to 2026
-
Figure Development Trends and Industry Dynamics of 3D Glass Industry
-
Figure Market Challenges and Restraints
-
Figure Market Opportunities and Potentials
-
Table Mergers and Acquisition
-
Figure Market Share of TOP 3 Players in 2018
-
Figure Market Share of TOP 5 Players in 2018
-
Figure Market Share of TOP 6 Players from 2014 to 2019
-
Figure Porter's Five Forces Analysis
-
Figure New Entrant SWOT Analysis
-
Table Specifications of Different Types of 3D Glass
-
Figure Development Trends of Different Types
-
Table Commercial Products Types of Major Vendors
-
Figure Competitive Landscape Analysis of Different Types
-
Table Consumption of 3D Glass by Different Types from 2014 to 2026
-
Table Consumption Share of 3D Glass by Different Types from 2014 to 2026
-
Figure Market Size and Growth Rate of 3D Glass Display
-
Figure Market Size and Growth Rate of 3D Glass Back Cover
-
Figure Market Size and Growth Rate of Others
-
Table Downstream Client Analysis by End-Users
-
Figure Competitive Landscape Analysis of Different End-Users
-
Table Market Potential Analysis of Different End-Users
-
Table Consumption of 3D Glass by Different End-Users from 2014 to 2026
-
Table Consumption Share of 3D Glass by Different End-Users from 2014 to 2026
-
Figure Market Size and Growth Rate of Smart Phone
-
Figure Market Size and Growth Rate of Wearable Device
-
Figure Market Size and Growth Rate of Others
-
Table Global 3D Glass Production by Major Regions
-
Table Global 3D Glass Production Share by Major Regions
-
Figure Global 3D Glass Production Share by Major Regions in 2014
-
Figure Global 3D Glass Production Share by Major Regions in 2018
-
Figure Global 3D Glass Production Share by Major Regions in 2026
-
Table Global 3D Glass Consumption by Major Regions
-
Table Global 3D Glass Consumption Share by Major Regions
-
Figure Global 3D Glass Consumption Share by Major Regions in 2014
-
Figure Global 3D Glass Consumption Share by Major Regions in 2018
-
Figure Global 3D Glass Consumption Share by Major Regions in 2026
-
Table North America 3D Glass Production, Import, Consumption and Export Analysis
-
Table Europe 3D Glass Production, Import, Consumption and Export Analysis
-
Table Asia Pacific 3D Glass Production, Import, Consumption and Export Analysis
-
Table Latin America, Middle East & Africa 3D Glass Production, Import, Consumption and Export Analysis
-
Table Top 5 Export Countries' Export Value Analysis in 3D Glass market from 2014 to 2019
-
Table Top 5 Export Countries' Export Volume Analysis in 3D Glass market from 2014 to 2019
-
Table Top 5 Import Countries' Import Value Analysis in 3D Glass market from 2014 to 2019
-
Table Top 5 Import Countries' Import Volume Analysis in 3D Glass market from 2014 to 2019
-
Figure Emerging Top 3 Export Countries Analysis
-
Figure Emerging Top 3 Import Countries Analysis
-
Table North America 3D Glass Consumption by Types from 2014 to 2026
-
Table North America 3D Glass Consumption Share by Types from 2014 to 2026
-
Figure North America 3D Glass Consumption Share by Types in 2014
-
Figure North America 3D Glass Consumption Share by Types in 2018
-
Figure North America 3D Glass Consumption Share by Types in 2026
-
Table North America 3D Glass Consumption by End-Users from 2014 to 2026
-
Table North America 3D Glass Consumption Share by End-Users from 2014 to 2026
-
Figure North America 3D Glass Consumption Share by End-Users in 2014
-
Figure North America 3D Glass Consumption Share by End-Users in 2018
-
Figure North America 3D Glass Consumption Share by End-Users in 2026
-
Table North America 3D Glass Consumption by Major Countries from 2014 to 2026
-
Table North America 3D Glass Consumption Share by Major Countries from 2014 to 2026
-
Figure North America 3D Glass Consumption Share by Major Countries in 2014
-
Figure North America 3D Glass Consumption Share by Major Countries in 2018
-
Figure North America 3D Glass Consumption Share by Major Countries in 2026
-
Figure United States 3D Glass Market Volume and Growth Rate from 2014 to 2026
-
Figure Canada 3D Glass Market Volume and Growth Rate from 2014 to 2026
-
Figure Mexico 3D Glass Market Volume and Growth Rate from 2014 to 2026
-
Table Europe 3D Glass Consumption by Types from 2014 to 2026
-
Table Europe 3D Glass Consumption Share by Types from 2014 to 2026
-
Figure Europe 3D Glass Consumption Share by Types in 2014
-
Figure Europe 3D Glass Consumption Share by Types in 2018
-
Figure Europe 3D Glass Consumption Share by Types in 2026
-
Table Europe 3D Glass Consumption by End-Users from 2014 to 2026
-
Table Europe 3D Glass Consumption Share by End-Users from 2014 to 2026
-
Figure Europe 3D Glass Consumption Share by End-Users in 2014
-
Figure Europe 3D Glass Consumption Share by End-Users in 2018
-
Figure Europe 3D Glass Consumption Share by End-Users in 2026
-
Table Europe 3D Glass Consumption by Major Countries from 2014 to 2026
-
Table Europe 3D Glass Consumption Share by Major Countries from 2014 to 2026
-
Figure Europe 3D Glass Consumption Share by Major Countries in 2014
-
Figure Europe 3D Glass Consumption Share by Major Countries in 2018
-
Figure Europe 3D Glass Consumption Share by Major Countries in 2026
-
Figure Germany 3D Glass Market Volume and Growth Rate from 2014 to 2026
-
Figure UK 3D Glass Market Volume and Growth Rate from 2014 to 2026
-
Figure France 3D Glass Market Volume and Growth Rate from 2014 to 2026
-
Figure Italy 3D Glass Market Volume and Growth Rate from 2014 to 2026
-
Figure Nordic Countries 3D Glass Market Volume and Growth Rate from 2014 to 2026
-
Figure Belgium 3D Glass Market Volume and Growth Rate from 2014 to 2026
-
Figure Poland 3D Glass Market Volume and Growth Rate from 2014 to 2026
-
Figure Russia 3D Glass Market Volume and Growth Rate from 2014 to 2026
-
Figure Turkey 3D Glass Market Volume and Growth Rate from 2014 to 2026
-
Table Asia Pacific 3D Glass Consumption by Types from 2014 to 2026
-
Table Asia Pacific 3D Glass Consumption Share by Types from 2014 to 2026
-
Figure Asia Pacific 3D Glass Consumption Share by Types in 2014
-
Figure Asia Pacific 3D Glass Consumption Share by Types in 2018
-
Figure Asia Pacific 3D Glass Consumption Share by Types in 2026
-
Table Asia Pacific 3D Glass Consumption by End-Users from 2014 to 2026
-
Table Asia Pacific 3D Glass Consumption Share by End-Users from 2014 to 2026
-
Figure Asia Pacific 3D Glass Consumption Share by End-Users in 2014
-
Figure Asia Pacific 3D Glass Consumption Share by End-Users in 2018
-
Figure Asia Pacific 3D Glass Consumption Share by End-Users in 2026
-
Table Asia Pacific 3D Glass Consumption by Major Countries from 2014 to 2026
-
Table Asia Pacific 3D Glass Consumption Share by Major Countries from 2014 to 2026
-
Figure Asia Pacific 3D Glass Consumption Share by Major Countries in 2014
-
Figure Asia Pacific 3D Glass Consumption Share by Major Countries in 2018
-
Figure Asia Pacific 3D Glass Consumption Share by Major Countries in 2026
-
Figure China 3D Glass Market Volume and Growth Rate from 2014 to 2026
-
Figure Japan 3D Glass Market Volume and Growth Rate from 2014 to 2026
-
Figure Australia and New Zealand3D Glass Market Volume and Growth Rate from 2014 to 2026
-
Figure India 3D Glass Market Volume and Growth Rate from 2014 to 2026
-
Figure ASEAN Countries 3D Glass Market Volume and Growth Rate from 2014 to 2026
-
Figure South Korea 3D Glass Market Volume and Growth Rate from 2014 to 2026
-
Table Latin America, Middle East & Africa 3D Glass Consumption by Types from 2014 to 2026
-
Table Latin America, Middle East & Africa 3D Glass Consumption Share by Types from 2014 to 2026
-
Figure Latin America, Middle East & Africa 3D Glass Consumption Share by Types in 2014
-
Figure Latin America, Middle East & Africa 3D Glass Consumption Share by Types in 2018
-
Figure Latin America, Middle East & Africa 3D Glass Consumption Share by Types in 2026
-
Table Latin America, Middle East & Africa 3D Glass Consumption by End-Users from 2014 to 2026
-
Table Latin America, Middle East & Africa 3D Glass Consumption Share by End-Users from 2014 to 2026
-
Figure Latin America, Middle East & Africa 3D Glass Consumption Share by End-Users in 2014
-
Figure Latin America, Middle East & Africa 3D Glass Consumption Share by End-Users in 2018
-
Figure Latin America, Middle East & Africa 3D Glass Consumption Share by End-Users in 2026
-
Table Latin America, Middle East & Africa 3D Glass Consumption by Major Countries from 2014 to 2026
-
Table Latin America, Middle East & Africa 3D Glass Consumption Share by Major Countries from 2014 to 2026
-
Figure Latin America, Middle East & Africa 3D Glass Consumption Share by Major Countries in 2014
-
Figure Latin America, Middle East & Africa 3D Glass Consumption Share by Major Countries in 2018
-
Figure Latin America, Middle East & Africa 3D Glass Consumption Share by Major Countries in 2026
-
Figure GCC Countries 3D Glass Market Volume and Growth Rate from 2014 to 2026
-
Figure Brazil 3D Glass Market Volume and Growth Rate from 2014 to 2026
-
Figure Nigeria 3D Glass Market Volume and Growth Rate from 2014 to 2026
-
Figure South Africa 3D Glass Market Volume and Growth Rate from 2014 to 2026
-
Figure Argentina 3D Glass Market Volume and Growth Rate from 2014 to 2026
-
Table Company Profile and Development Status of LENS
-
Table Sales, Revenue, Sales Price and Gross Margin Analysis of LENS
-
Figure Sales and Growth Rate Analysis of LENS
-
Figure Revenue and Market Share Analysis of LENS
-
Table Product and Service Introduction of LENS
-
Table Company Profile and Development Status of Bourne optics
-
Table Sales, Revenue, Sales Price and Gross Margin Analysis of Bourne optics
-
Figure Sales and Growth Rate Analysis of Bourne optics
-
Figure Revenue and Market Share Analysis of Bourne optics
-
Table Product and Service Introduction of Bourne optics
-
Table Company Profile and Development Status of CORNING
-
Table Sales, Revenue, Sales Price and Gross Margin Analysis of CORNING
-
Figure Sales and Growth Rate Analysis of CORNING
-
Figure Revenue and Market Share Analysis of CORNING
-
Table Product and Service Introduction of CORNING
-
Table Company Profile and Development Status of SCHOTT
-
Table Sales, Revenue, Sales Price and Gross Margin Analysis of SCHOTT
-
Figure Sales and Growth Rate Analysis of SCHOTT
-
Figure Revenue and Market Share Analysis of SCHOTT
-
Table Product and Service Introduction of SCHOTT
-
Table Company Profile and Development Status of NEG
-
Table Sales, Revenue, Sales Price and Gross Margin Analysis of NEG
-
Figure Sales and Growth Rate Analysis of NEG
-
Figure Revenue and Market Share Analysis of NEG
-
Table Product and Service Introduction of NEG
-
Table Company Profile and Development Status of AGC
-
Table Sales, Revenue, Sales Price and Gross Margin Analysis of AGC
-
Figure Sales and Growth Rate Analysis of AGC
-
Figure Revenue and Market Share Analysis of AGC
-
Table Product and Service Introduction of AGC
-
Table Company Profile and Development Status of First-panel
-
Table Sales, Revenue, Sales Price and Gross Margin Analysis of First-panel
-
Figure Sales and Growth Rate Analysis of First-panel
-
Figure Revenue and Market Share Analysis of First-panel
-
Table Product and Service Introduction of First-panel
-
Table Company Profile and Development Status of FOXCONN
-
Table Sales, Revenue, Sales Price and Gross Margin Analysis of FOXCONN
-
Figure Sales and Growth Rate Analysis of FOXCONN
-
Figure Revenue and Market Share Analysis of FOXCONN
-
Table Product and Service Introduction of FOXCONN
-
Table Company Profile and Development Status of O-film
-
Table Sales, Revenue, Sales Price and Gross Margin Analysis of O-film
-
Figure Sales and Growth Rate Analysis of O-film
-
Figure Revenue and Market Share Analysis of O-film
-
Table Product and Service Introduction of O-film
-
Table Company Profile and Development Status of Holitech Technology
-
Table Sales, Revenue, Sales Price and Gross Margin Analysis of Holitech Technology
-
Figure Sales and Growth Rate Analysis of Holitech Technology
-
Figure Revenue and Market Share Analysis of Holitech Technology
-
Table Product and Service Introduction of Holitech Technology
-
Table Company Profile and Development Status of KMTC
-
Table Sales, Revenue, Sales Price and Gross Margin Analysis of KMTC
-
Figure Sales and Growth Rate Analysis of KMTC
-
Figure Revenue and Market Share Analysis of KMTC
-
Table Product and Service Introduction of KMTC
-
Table Company Profile and Development Status of Gtoc
-
Table Sales, Revenue, Sales Price and Gross Margin Analysis of Gtoc
-
Figure Sales and Growth Rate Analysis of Gtoc
-
Figure Revenue and Market Share Analysis of Gtoc
-
Table Product and Service Introduction of Gtoc
-