An indoor air quality (IAQ) meter is a device used to detect indoor air quality. It can meter indicators such as temperature, humidity, PM2.5, formaldehyde, TVOC, etc. in indoor air, helping users understand the indoor air quality situation and take corresponding measures to improve the indoor environment. IAQ meters usually have the characteristics of intelligence, real-time, reliability, and humanization.
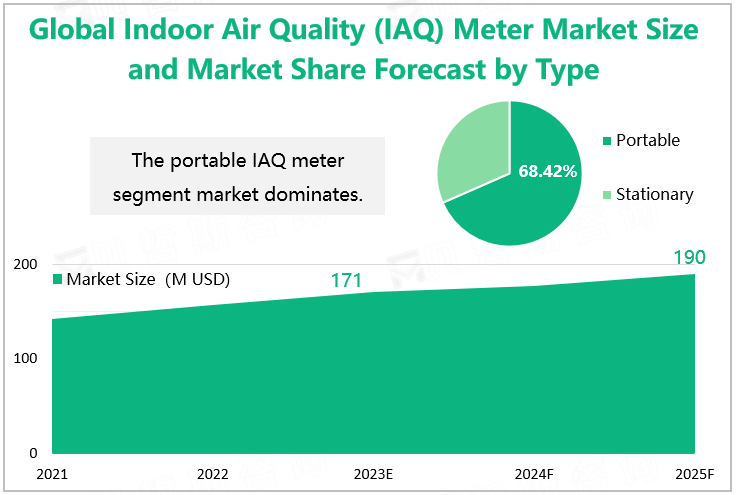
With the increasing attention to indoor environmental quality and the rapid development of the smart home market, indoor air quality meters have become essential equipment for many homes and offices. The indoor air quality meter market has shown a steady growth trend in recent years. According to our research data, the global market size of indoor air quality meters is expected to reach $171 million in 2023. In the future, with the continuous development of technology, the performance and functionality of meter products will also be further improved, which will bring more opportunities to the market. It is estimated that the global market size of indoor air quality meters will reach $190 million by 2025.
Based on different usage methods, indoor air quality meters can be divided into two categories: portable (handheld) and fixed. Among them, portable meters dominate the market, with an estimated market share of 68.42% in 2023.
Global Indoor Air Quality (IAQ) Meter Market Size and Market Share Forecast by Type

Source: www.globalmarketmonitor.com
Research shows that North America is the world\'s largest revenue market for indoor air quality meters. The market size is expected to reach $66 million in 2023, with an estimated market share of 38.40%; Europe will rank second with a market size of $57 million and a share of 33.33%; In 2023, the market size of indoor air quality meters in the Asia-Pacific region is estimated to be $42 million, and it is expected to rank third with a market share of 24.56%.
Global IAQ Meter Market Size and Market Share by Region in 2023
|
Regions
|
Market Size(M USD)
|
Market Share
|
|
North America
|
66
|
38.40%
|
|
Europe
|
57
|
33.33%
|
|
Asia Pacific
|
42
|
24.56%
|
|
South America
|
4
|
2.34%
|
|
Middle East & Africa
|
2
|
1.17%
|
|
Global
|
171
|
100%
|
Source: www.globalmarketmonitor.com
